
Vous pouvez lire le billet sur le blog La Minute pour plus d'informations sur les RSS !
Canaux
7207 éléments (2941 non lus) dans 50 canaux
 Dans la presse
(2756 non lus)
Dans la presse
(2756 non lus)
-
 Cybergeo
(2691 non lus)
Cybergeo
(2691 non lus) -
Mappemonde
(60 non lus)
-
Dans les algorithmes
(5 non lus)
Du côté des éditeurs
(28 non lus)
-
Toute l’actualité des Geoservices de l'IGN
(17 non lus)
-
arcOpole - Actualités du Programme
-
arcOrama
(11 non lus)
-
Neogeo
Toile géomatique francophone
(110 non lus)
-
Géoblogs (GeoRezo.net) (5 non lus)
-
UrbaLine (le blog d'Aline sur l'urba, la géomatique, et l'habitat)
-
Séries temporelles (CESBIO)
(2 non lus)
-
Datafoncier, données pour les territoires (Cerema)
-
Cartes et figures du monde
-
SIGEA: actualités des SIG pour l'enseignement agricole
-
Data and GIS tips
-
ReLucBlog
-
L'Atelier de Cartographie
-
My Geomatic
-
archeomatic (le blog d'un archéologue à l’INRAP)
-
Cartographies numériques
-
Carnet (neo)cartographique
-
GEOMATIQUE
-
Évènements – Afigéo
(12 non lus)
-
Afigéo
(12 non lus)
-
Geotribu
(50 non lus)
-
Conseil national de l'information géolocalisée
(9 non lus)
-
Icem7
-
Makina Corpus (1 non lus)
-
Oslandia
(1 non lus)
-
CartONG
(2 non lus)
-
GEOMATICK
(6 non lus)
-
Geomatys
(3 non lus)
-
Les Cafés Géo
(1 non lus)
-
L'Agenda du Libre
(3 non lus)
-
Conseil national de l'information géolocalisée - Actualités
(3 non lus)
Géomatique anglophone
(35 non lus)
-
All Points Blog
-
Directions Media - Podcasts
-
Navx
-
James Fee GIS Blog
-
Maps Mania
(19 non lus)
-
Open Geospatial Consortium (OGC)
-
Planet OSGeo
(16 non lus)
Géomatique anglophone
-
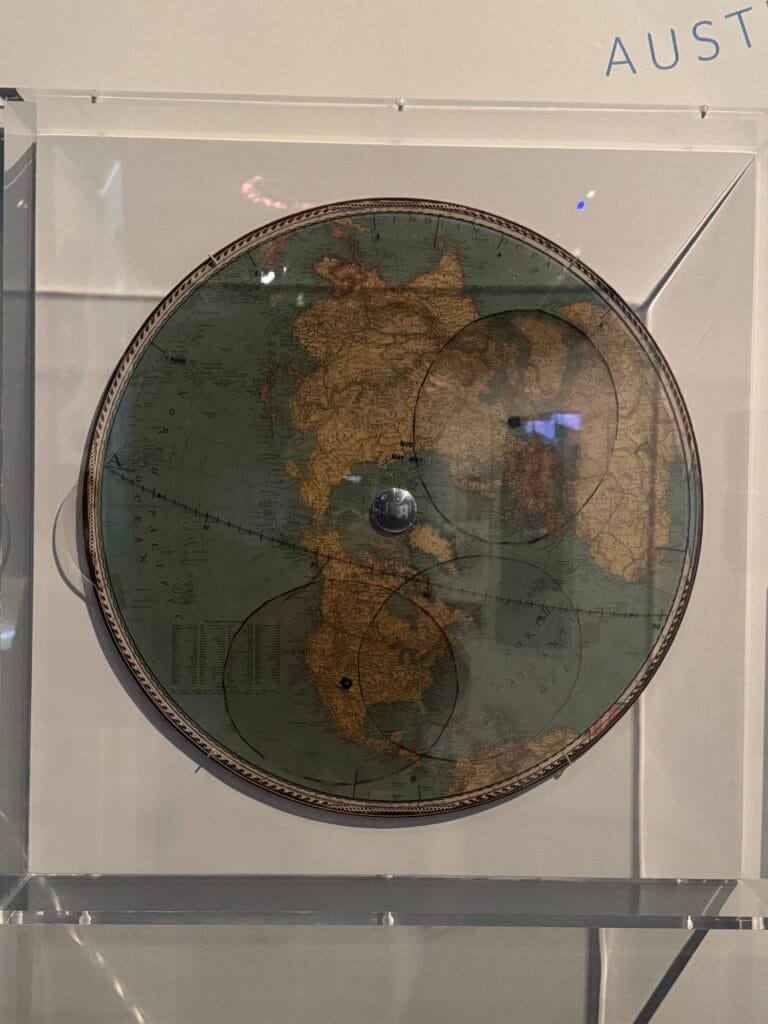
sur Mappery: Schatz die Welt
Publié: 23 February 2025, 12:00pm CET
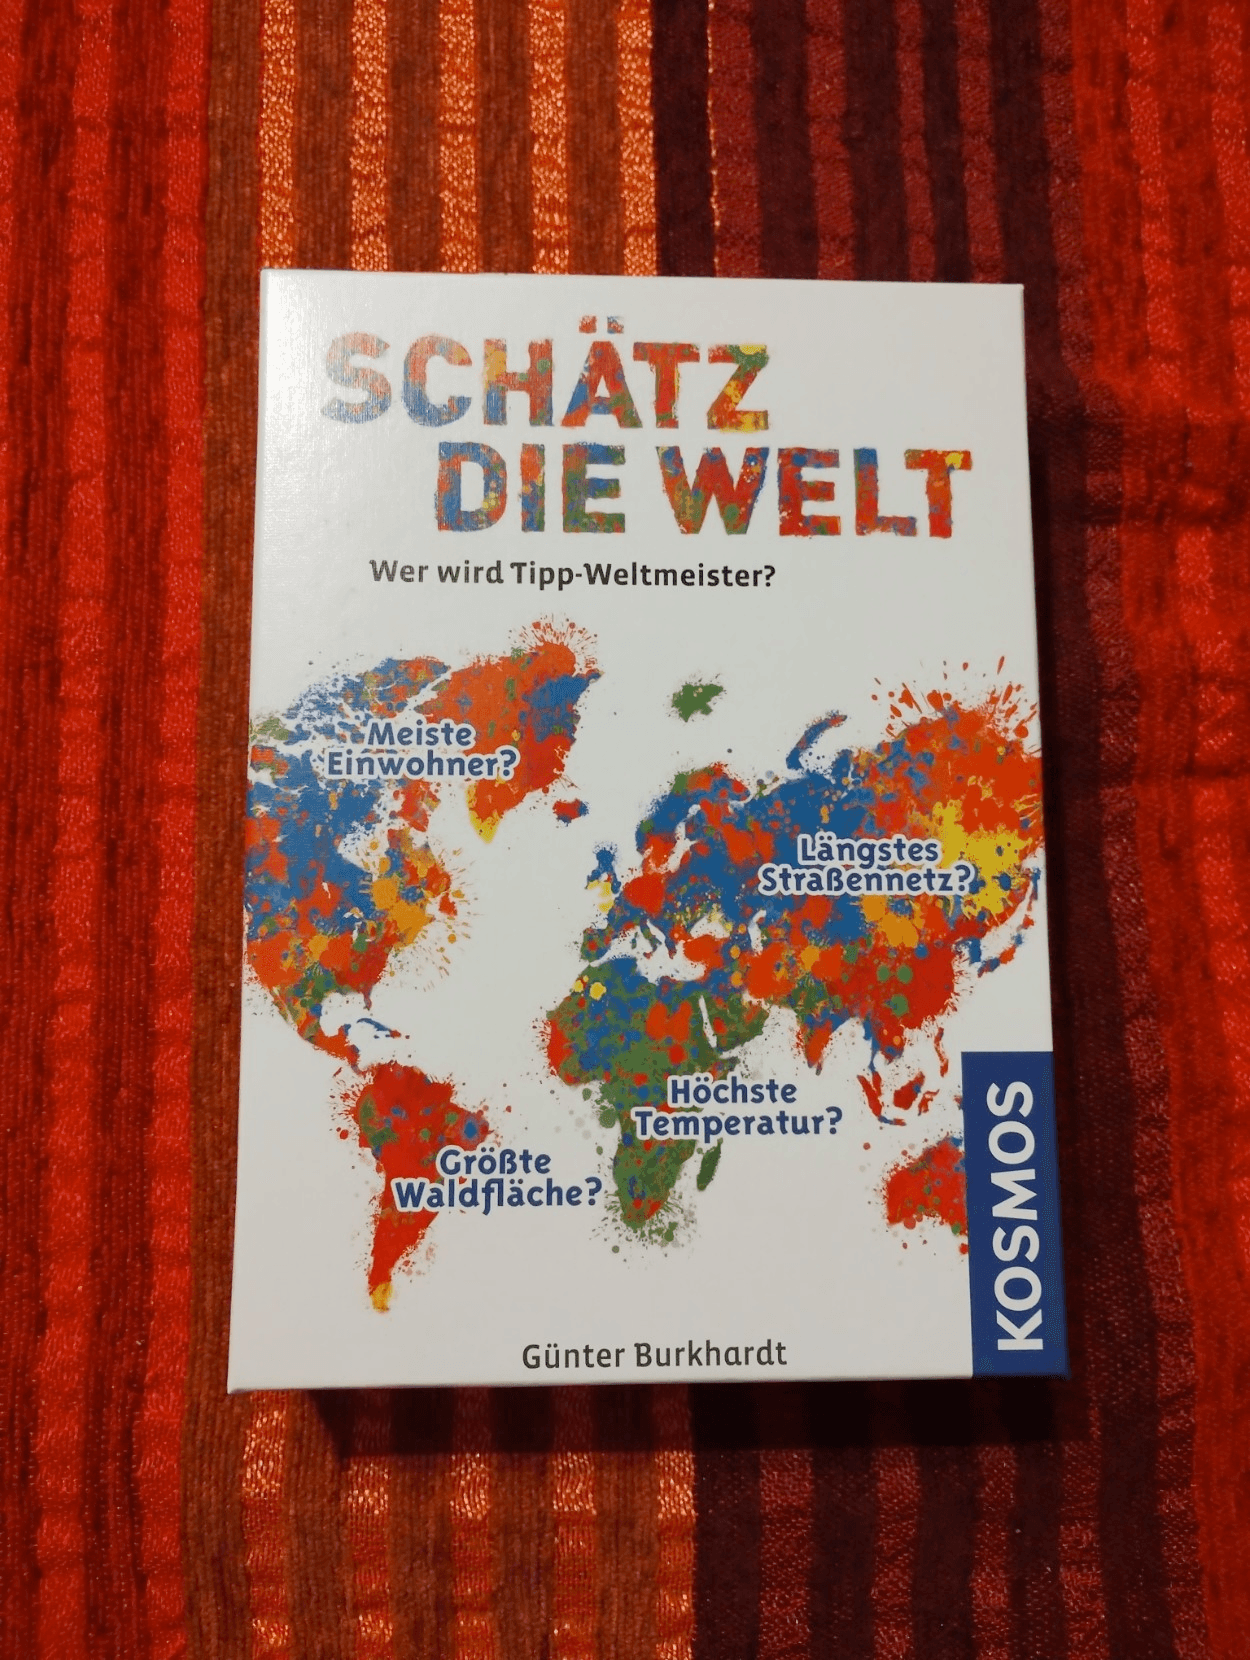

Jaview Jimenz Shaw shared this board game. The translation of the box is:
APPRECIATE THE WORLD
Who will be the betting world champion?
Most residents?
Longest road network?
Largest forest area?
Highest temperature?

-
sur QGIS Blog: QGIS Grants #10: Call for Grant Proposals 2025
Publié: 23 February 2025, 10:13am CET
Dear QGIS Community,
We are very pleased to announce that this year’s round of grants is now available. The call is open to anybody who wants to make a contribution to QGIS funded by our grant fund, subject to the call conditions outlined in the application form.
This year’s budget is €50k and the deadline for the proposals is in four weeks, on Wednesday, 26 March 2025. Here’s the full timeline:
Timeline- 2025-02-23: Call for proposals (4 weeks)
- 2025-03-26: QEP discussion period (2 weeks)
- 2025-04-09: Writing discussion summaries (1 week)
- 2025-04-16: Voting starts (2 weeks)
- 2025-04-30: Publication of results
- — 6 months of project work —
- 2025-10-30: Deadline for follow-up reports
There are no new procedures in 2025. Please note the following guidelines established in previous years:
- The proposal must be submitted as a ‘QEP’ (QGIS Enhancement Proposal) issue in the repo: [https:]] (tagged as Grant-2025). Following this approach will allow people to ask questions and provide public feedback on individual proposals.
- Proposals must clearly define the expected final result so that we can properly assess if the goal of the proposal has been reached.
- The project budgets should account for PR reviewing expenses to ensure timely handling of the project-related PRs and avoid delays caused by relying on reviewer volunteer time.
- In the week after the QEP discussion period, the proposal authors are expected to write a short summary of the discussion that is suitable for use as a basis on which voting members make their decisions.
The PSC of QGIS.ORG will examine the proposals and has veto power in case a proposal does not follow guidelines or is not in line with project priorities.
For more details, please read the introduction provided in the application form.
We look forward to seeing all your great ideas for improving QGIS!
-
sur Mappery: Map of Africa found in Africa
Publié: 22 February 2025, 12:00pm CET
Pièce jointe: [télécharger]

?Ragnvald shared this map of Africa found in a Bar in Malawi
-
sur Paul Ramsey: Book Pairings
Publié: 22 February 2025, 2:00am CET
A funny thing happened when I wrote up my 2025 book list – a lot of the books were parts of pairings. And I started wondering what other pairings I had read that were memorable.
So here’s another list!
Wicked, Gregory Maguire and The Wonderful Wizard of Oz, L. Frank Baum


You wouldn’t know it to look at me (or would you?) but I am a person who has read all 14 books of the original L. Frank Baum Oz series. From “The Wonderful Wizard of Oz” to “Glinda of Oz” and all in between.
As… that kind of person, I was truly tickled to pick up “Wicked” a couple years ago and take in not only the invented back-story of the Wicked Witch of the West (Elphaba), but also all the references to the Oz world that Maguire builds into his narrative. “Wicked” is the best kind of reimagining, one that manages a completely fresh story, but without tearing down the original source material on the way. Maguire clearly is also… that kind of person, and he treats Oz with respect while building a totally fresh take. Loved it so much.
Pride and Prejudice, Jane Asten and Longbourne, Jo Baker


I came across “Longbourne” as a book recommendation from the hosts of the Strict Scrutiny Podcast (a podcast that current events renders more relevant every day). Like “Wicked”, “Longbourne” picks in the same world as the source, but manages to tell an entirely unique story that pays tribute to the original.
“Longbourn” is told entirely from the point of view of the servants in the Bennet family home. It both tells a heart warming love story, and illuminates just how different the circumstances of the upstairs and downstairs of the house are.
The version I had conveniently included both “Longbourn” and the entirety of “Pride and Prejudice” in one volume. It was crazy to read the old novel and see just how little the service staff figured in the story. And yet, as “Longbourn” makes clear, they would have been omnipresent, working hard every day, 24/7.
Adventures of Huckleberry Finn, Mark Twain and James, Percival Everett

“James” showed up on number of “best of” lists for 2024, and I deliberately read it after doing a re-read of Huck Finn. The central conceit of “James” is that the slaves are all play acting the character of “slave” in front of the white world, but have a rich secret intellectual life they only show to one another. This makes Everett’s “James” an engaging narrator, well read, ironic at times, and observant, but no more compelling as a human being than Twain’s “Jim”.
For me, after the first third of the book, “James” did not have a lot new to offer. Everett has to work through all the narrative beats of the original material, but does not have much more to offer than the central twist. In those parts of the story where James is separated from Huck, and Everett has the freedom to write his own narrative for James, I found the story more engaging, but when he is stuck inside Twain’s story arc, the book kind of grinds along.
March, Geraldine Brooks and Little Women, Louisa May Alcott


“March” tells the tale of the largely absent father figure of “Little Women”, abolitionist Mr. March, who heads off join the Union Army as a chaplain, and ends up having as miserable a time as one would expect, in the Battle of the Wilderness and then on a Union-occupied plantation.
I found this book on the Pullitzer list (winner for 2006) and it was a great engaging read, good for anyone interested in a little Civil War fiction that does not shy away from just how miserable an experience war is. The human wreckage of battle, the devestation of every built structure, the disappearance of civil society and law. March heads off to war thinking he can make a difference. He returns much more realistic.
Demon Copperhead, Barbara Kingsolver and David Copperfield, Charles Dickens


The “Demon Copperhead” and “David Copperfield” pairing I wrote about before. I picked up “Copperfield” right away after “Demon” to explore all the connections that Kingsolver had built into her tale, and I was a little surprised to find out how much she’d changed. Some of her characters had no analogues in Dickens and vice versa. Parts of the plot were gone or re-arranged or had no obvious analogue. Which was all fine, since “Demon Copperhead” stands perfectly well on its own.
1984, George Orwell and Julia, Sandra Newman


Also wrote about these before. Worth reading together, if only to appreciate, in Newman’s telling, just how much of a self-absorbed prig Winston Smith actually is.
-
sur Mappery: African bag
Publié: 21 February 2025, 12:00pm CET


Spotted this bag on the tube recently
-
sur Mappery: Miniature
Publié: 20 February 2025, 12:00pm CET


Wanmei shared her craft miniatures featuring maps
-
sur GeoTools Team: GeoTools 31.6 released
Publié: 19 February 2025, 3:34pm CET
The GeoTools team is pleased to announce the release of the latest stable version of GeoTools 31.6: geotools-31.6-bin.zip geotools-31.6-doc.zip geotools-31.6-userguide.zip geotools-31.6-project.zip This release is also available from the OSGeo Maven Repository and is made in conjunction with GeoServer 2.25.6 and GeoWebCache 1.25.4. We are grateful to -
sur Mappery: Washington Metro
Publié: 19 February 2025, 12:00pm CET


Who doesn’t love a good metro map/diagram? Surely not our community of Maps in the Wild lovers?
This is the Washington Metro Map which was very useful for getting to the National Air and Space Museum which has featured a lot over the last couple of weeks
-
sur Mappery: Loyalty map
Publié: 18 February 2025, 12:00pm CET
Pièce jointe: [télécharger]

Dean shared this Loyalty card mapping a coffee place.
-
sur Spring Training 2025
Publié: 18 February 2025, 2:16am CET par James

This week is one of the best in baseball—the start of Spring Training, with players practice already underway. Sadly, it’s been a long time since the Giants last made a World Series run, and the Dodgers are as annoying as ever. But hey, the team is healthy, and baseball is always fun to watch!

-
sur Mappery: UN HQ
Publié: 17 February 2025, 12:00pm CET


The United nations headquarters building in New York has their world map logo all over the place.


-
sur GeoServer Team: GeoServer 2.25.6 Release
Publié: 17 February 2025, 2:00am CET
GeoServer 2.25.6 release is now available with downloads (bin, war, windows), along with docs and extensions.
This series has now reached end-of-life, and it is recommended to plan an upgrade to 2.26.x or the upcoming 2.27.0 soon.
GeoServer 2.25.6 is made in conjunction with GeoTools 31.6, and GeoWebCache 1.25.4.Thanks to Peter Smythe (AfriGIS) for making this release.
Release notesImprovement:
- GEOS-11651 Support env parametrization on OIDC filter
- GEOS-11652 Externalize printing configuration folder
- GEOS-11677 Hide version info on GWC home page
Bug:
- GEOS-10844 Exclude xml-apis from build
- GEOS-11649 welcome page per-layer is not respecting global service enablement
- GEOS-11664 Update REST security paths
- GEOS-11672 GWC virtual services available with empty contents
- GEOS-11690 Bug in Externalize printing configuration folder
- GEOS-11694 OpenID connect: allow caching authentication when an expiration is declared in the access token
- GEOS-11696 AdminRequestCallback not loaded due to spring bean name conflict
- GEOS-11700 GeoFence fails in recognizing some caller IP address
- GEOS-11707 Ogr2OgrWfsTest test failures with GDAL 3.10.1
- GEOS-11711 Clickhouse DGGS stores fails to aggregate on dates
- GEOS-11713 Concurrent LDAP builds fail on Jenkins
- GEOS-11715 STAC sortby won’t work with “properties.” prefixed names
- GEOS-11716 WFS POST requests fail if a layer is misconfigured
Task:
- GEOS-11650 Update dependencies for monitoring-kafka module
- GEOS-11659 Apply Palantir Java format on GeoServer
- GEOS-11671 Upgrade H3 dependency to 3.7.3
- GEOS-11682 Add tests for WMS SLD XML request reader
- GEOS-11685 Bump jetty.version from 9.4.56.v20240826 to 9.4.57.v20241219
- GEOS-11701 Update JAI-Ext to 1.1.28
For the complete list see 2.25.6 release notes.
Community UpdatesCommunity module development:
- GEOS-11686 Clickhouse DGGS stores cannot properly read dates
- GEOS-11687 OGC API packages contain gs-web-core
Community modules are shared as source code to encourage collaboration. If a topic being explored is of interest to you, please contact the module developer to offer assistance.
About GeoServer 2.25 SeriesAdditional information on GeoServer 2.25 series:
- GeoServer 2.25 User Manual
- GeoServer 2024 Roadmap Plannings
- Raster Attribute Table extension
- Individual contributor clarification
Release notes: ( 2.25.6 | 2.25.5 | 2.25.4 | 2.25.3 | 2.25.2 | 2.25.1 | 2.25.0 | 2.25-RC )
-
sur EOX' blog: The Last Common Hamsters
Publié: 17 February 2025, 2:00am CET
The common hamster, once a familiar sight in European fields, is now teetering on the brink of extinction. Nature filmmaker and ecologist David Cebulla's documentary, "The Last Common Hamsters" ("Die Letzten Feldhamster"), explores this crisis. The documentary aired on the 17th of January 2025 at D ... -
sur Narcélio de Sá: Fina e os Mapas agora fala português!
Publié: 16 February 2025, 8:54pm CET
A jornada começou com um objetivo claro: tornar um material educativo valioso acessível para mais pessoas. “Fina e os Mapas”, um livro encantador que ensina crianças e jovens sobre mapas colaborativos e cartografia digital, já estava disponível em galego e espanhol. Agora, tenho o orgulho de anunciar que a versão em português está pronta e acessível para toda a comunidade!

Eu e minha esposa tivemos o prazer de trabalhar na tradução deste material e foi uma experiência incrível! Trazer essa história para o público lusófono reforça a importância de tornar conteúdos educativos mais acessíveis e de incentivar o aprendizado sobre cultura livre e colaboração digital desde a infância.
A história de Fina e sua avó nos leva a um universo onde tecnologia e cooperação se encontram. Ao longo da narrativa, as crianças descobrem que podem contribuir para a criação de mapas do mundo real por meio do OpenStreetMap, um projeto aberto e comunitário. Mais do que um livro, essa obra representa uma porta de entrada para o entendimento da colaboração digital e do impacto que cada um de nós pode ter na construção do conhecimento coletivo.

Ao chegar em casa, Fina corre para o seu quarto para pesquisar sobre mapas. Um projeto chama sua atenção. Ele se chama OpenStreetMap e se define como “um mapa do mundo, criado por pessoas como você e de uso livre”.
Traduções como essa são fundamentais. Quando disponibilizamos materiais educativos de forma aberta e acessível, ampliamos o alcance do conhecimento e criamos oportunidades para que mais crianças e jovens possam se envolver com a tecnologia de maneira significativa. Ensinar desde cedo sobre o valor da colaboração e da informação compartilhada é um passo essencial para formar cidadãos mais engajados e conscientes.
Essa conquista não teria sido possível sem o trabalho incrível da Associação GHANDALF (https://ghandalf.org), que não apenas criou esse material inspirador, mas também deu suporte imediato na organização do repositório no GitHub, facilitando todo o processo de tradução. O compromisso deles com a cultura livre e a educação aberta faz toda a diferença, e somos imensamente gratos por essa parceria!
Agora, a versão em português já está disponível gratuitamente no site do projeto: https://finaeosmapas.ghandalf.org.
Se você acredita no poder do conhecimento aberto, ajude a divulgar essa iniciativa. Compartilhe, comente e, quem sabe, inspire mais projetos educativos livres!


-
sur Mappery: Harry Beck – Partial Sketch for the 1951 Quad Royal Poster, 1950
Publié: 16 February 2025, 12:00pm CET

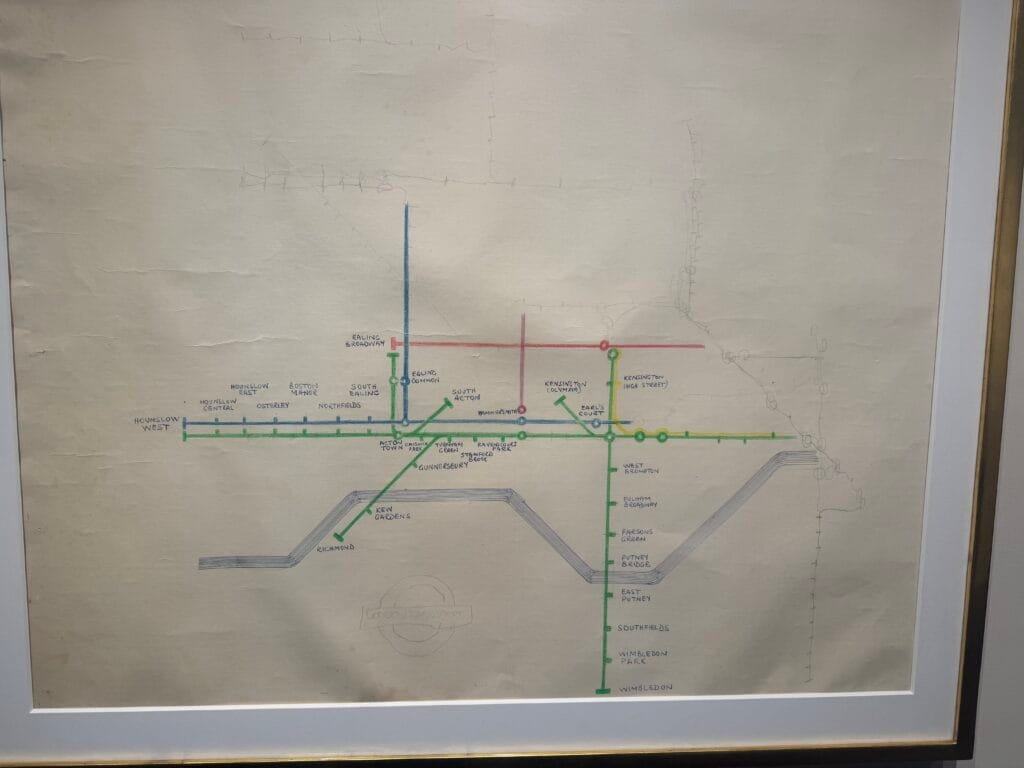
An incomplete sketch by Harry Beck, the designer of the iconic London Underground map. The hastily drawn sketch focuses on Southwest London as it intends to show a proposed new layout for the District Line branch to Richmond.
Much of the map is composed of crude pencil sketches, but the relevant areas have been tidied up and straightened with colour pencil. -
sur Mappery: Harry Beck’s first sketch of a diagonal Victoria Line
Publié: 15 February 2025, 12:00pm CET
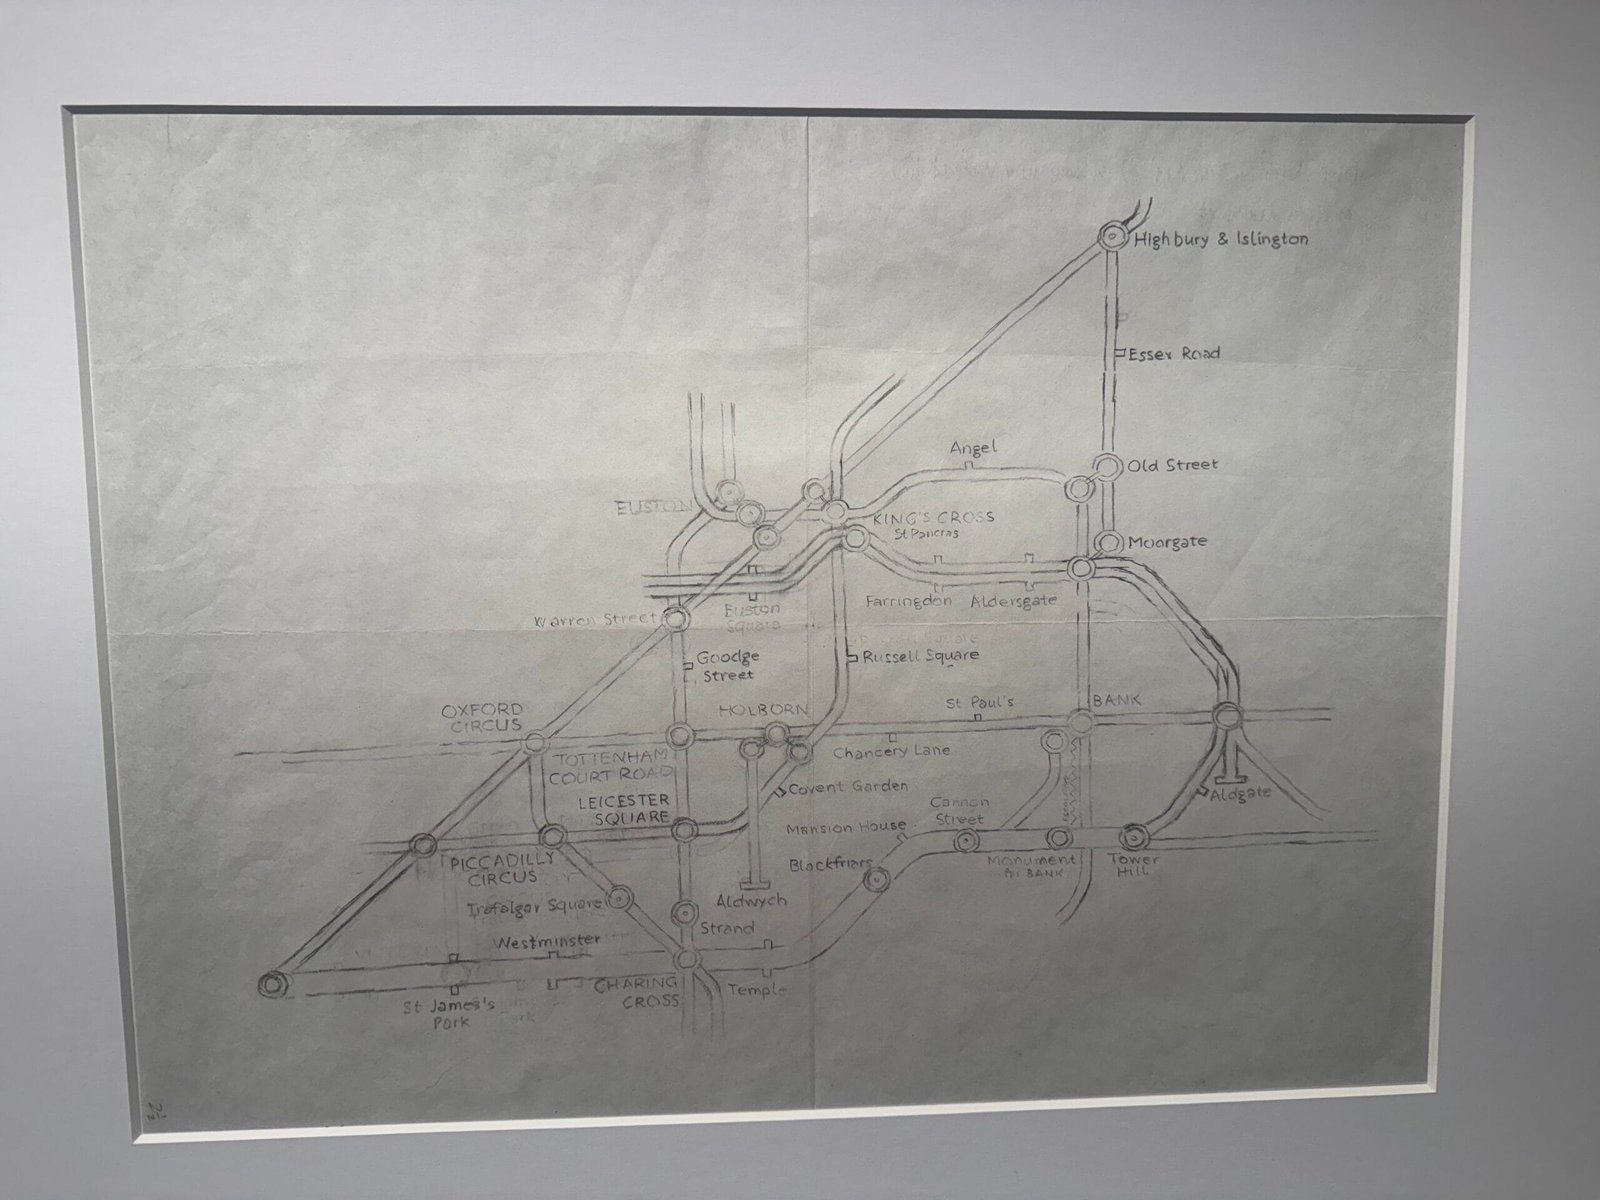
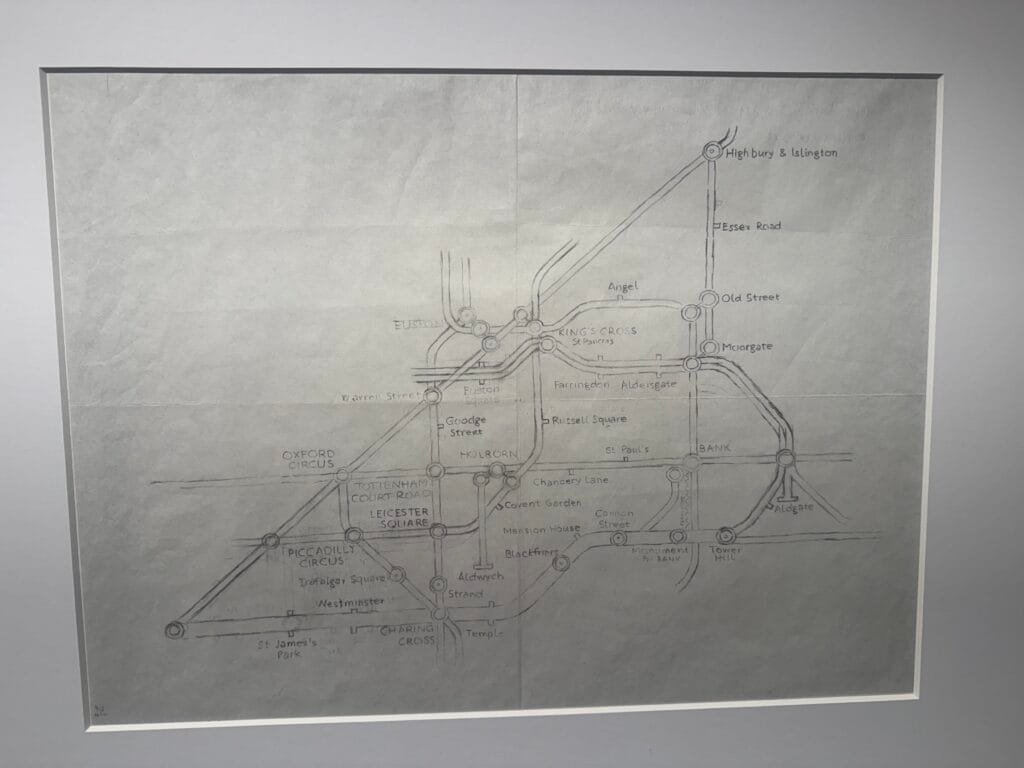
This unique manuscript sketch by Harry Beck, the designer of the iconic London Tube Map, shows an early attempt to add the Victoria Line (still under construction at the time) to his Underground diagram. His elegant and ingenious proposal introduces the Victoria line as a clean diagonal running from northeast to southwest. This sketch focuses on the most complex section of the map: Highbury & Islington to Victoria.Harry Beck had served as the chief designer for the London Underground map since 1933 when his revolutionary schematic design was first introduced to the public. With only a brief interlude from 1937 to 1941, Beck retained control of the design until 1960 when he was unceremoniously told by London Transport that his services were no longer required. Another member of London Transport’s Publicity Department, Harold Hutchinson, took it upon himself to produce a new Underground map in 1960, without consulting Beck and without following many of the key tenets of Beck’s design.
The Hutchinson design, much derided at the time, was felt to be a poor replacement with its harsh angles and inelegant zig-zagging lines. Beck may have thought that the arrival of the Victoria Line offered an opportunity to correct the errors of the Hutchinson design. After working for months to incorporate the new line, Beck submitted two Quad Royal posters for approval on 29 November 1961.
On those maps, the Victoria Line is portrayed in lilac, a colour which was ultimately abandoned as it was too difficult to print consistently. Both Quad Royal posters were returned less than two weeks later without comments. His elegant solution for the Victoria Line was never adopted. The following year, London Transport sent Harry Beck a dismissive letter in which they stated: “If at any time London Transport decides to use your map again, nobody but yourself will be commissioned to alter it and bring it up to date. The map now in use is of another design, and this is the one on which London Transport intends to show the Victoria Line and any other future additions to the Underground System.”
This wholly unfinished sketch provides a fascinating insight into Beck’s design process. -
sur Ecodiv.earth: Species distribution modeling using Maxent in GRASS GIS
Publié: 15 February 2025, 1:00am CET

I’m pleased to introduce new GRASS GIS add-ons that integrate Maxent-based species distribution modelling (SDM) with GRASS GIS spatial analysis tools. To help users get started, I’ve prepared a comprehensive step-by-step tutorial that walks you through the entire workflow.
Why these add-ons?Existing Maxent implementations often require programming skills, lack integrated GIS capabilities, or combine modelling steps in ways that obscure the underlying processes for novice users. The new GRASS GIS add-ons represent a front-end to the Maxent software package and aims to make it easy to carry out the different modeling steps while providing an integrated environment for the complete SDM workflow.
Four main steps of species distribution modelling and the corresponding add-ons
After importing the required data, the workflow starts with v.maxent.swd to prepare environmental and species occurrence data. It continues with r.maxent.train for model development and concludes with r.maxent.predict for generating distribution predictions. This modular approach hopefully maintains clarity for novice users while providing a complete workflow within the GRASS GIS environment.
Like any GRASS GIS module, these add-ons support both graphical and command-line interfaces, making them suitable for both interactive analysis and automated processing. This flexibility serves both new users exploring SDM concepts and more experienced users requiring reproducible and automated workflows. They also complement existing GRASS GIS machine learning tools, such as the r.learn.ml2 add-ons.
About the tutorialTo support these tools, I’ve created a tutorial that provides a structured approach to SDM in GRASS GIS. It guides users through the preparation of input data, model training, evaluation, and visualization of the result. The aim is to encourage exploration while maintaining a logical workflow.
I will use the tutorial in my upcoming course on species distribution modeling, course taught at the Applied Geo-information Science program HAS green academy and welcome feedback to improve it further. You can find the tutorial at [https:]] .


-
sur Resurrecting Planet Geospatial
Publié: 14 February 2025, 6:56pm CET par James
UPDATE: We have the domain working, you now just need to go to geofeeds.me and you’ll get the same results as below. The feed is at geofeeds.me/feed. You don’t need to update anything as the old urls will continue to work. Full speed ahead, make sure you reach out to Bill or myself if you want your blog, newsletter or other writing added.
A couple days ago, Bill Dollins reached out to me and had a crazy idea:
“Forget podcasting. We should resurrect planetgs”
It took me all of 10 seconds to respond, “Hell yes”. You can read the technical way it was brought back on Bill’s blog:
So, “Neptune” is born. The name is a nod to what Planet and Venus did/do, while the “N” planet hints at the Node underpinnings. Feel free to check it out. It’s about 50% me and about 50% Cursor. It’s not all the way baked, but good enough to release.
A lot has changed since I put Planet Geospatial to bed. It’s been 10 years, longer than Planet Geospatial was alive since the python script culled all those Blogger sites and spit out a HTML page and an RSS feed. The world has changed a couple times over, blogs which were falling out of style have started to come back, newsletters are everywhere and Twitter is a cesspool of junk.
Many of us had Planet Geospatial as our homepage (back when that was a thing) but feel free to grab the new temporary URL [https:]] and the new feed [https:]] . We’re working at getting an easier domain set up because I let PlanetGS.com go many years ago and alas it has been taken.
I hope this helps many of you start blogging again, we need all the good content to survive the next few years.
-
sur Mappery: Valentine’s Day
Publié: 14 February 2025, 12:00pm CET


To Celebrate Saint Valentine’s Day, what better map than Paris, the city of Love, with two lovers?
Painting on an old-school map by C215
-
sur Mappery: Harry Beck’s Sketches for the Victoria Line
Publié: 13 February 2025, 12:00pm CET
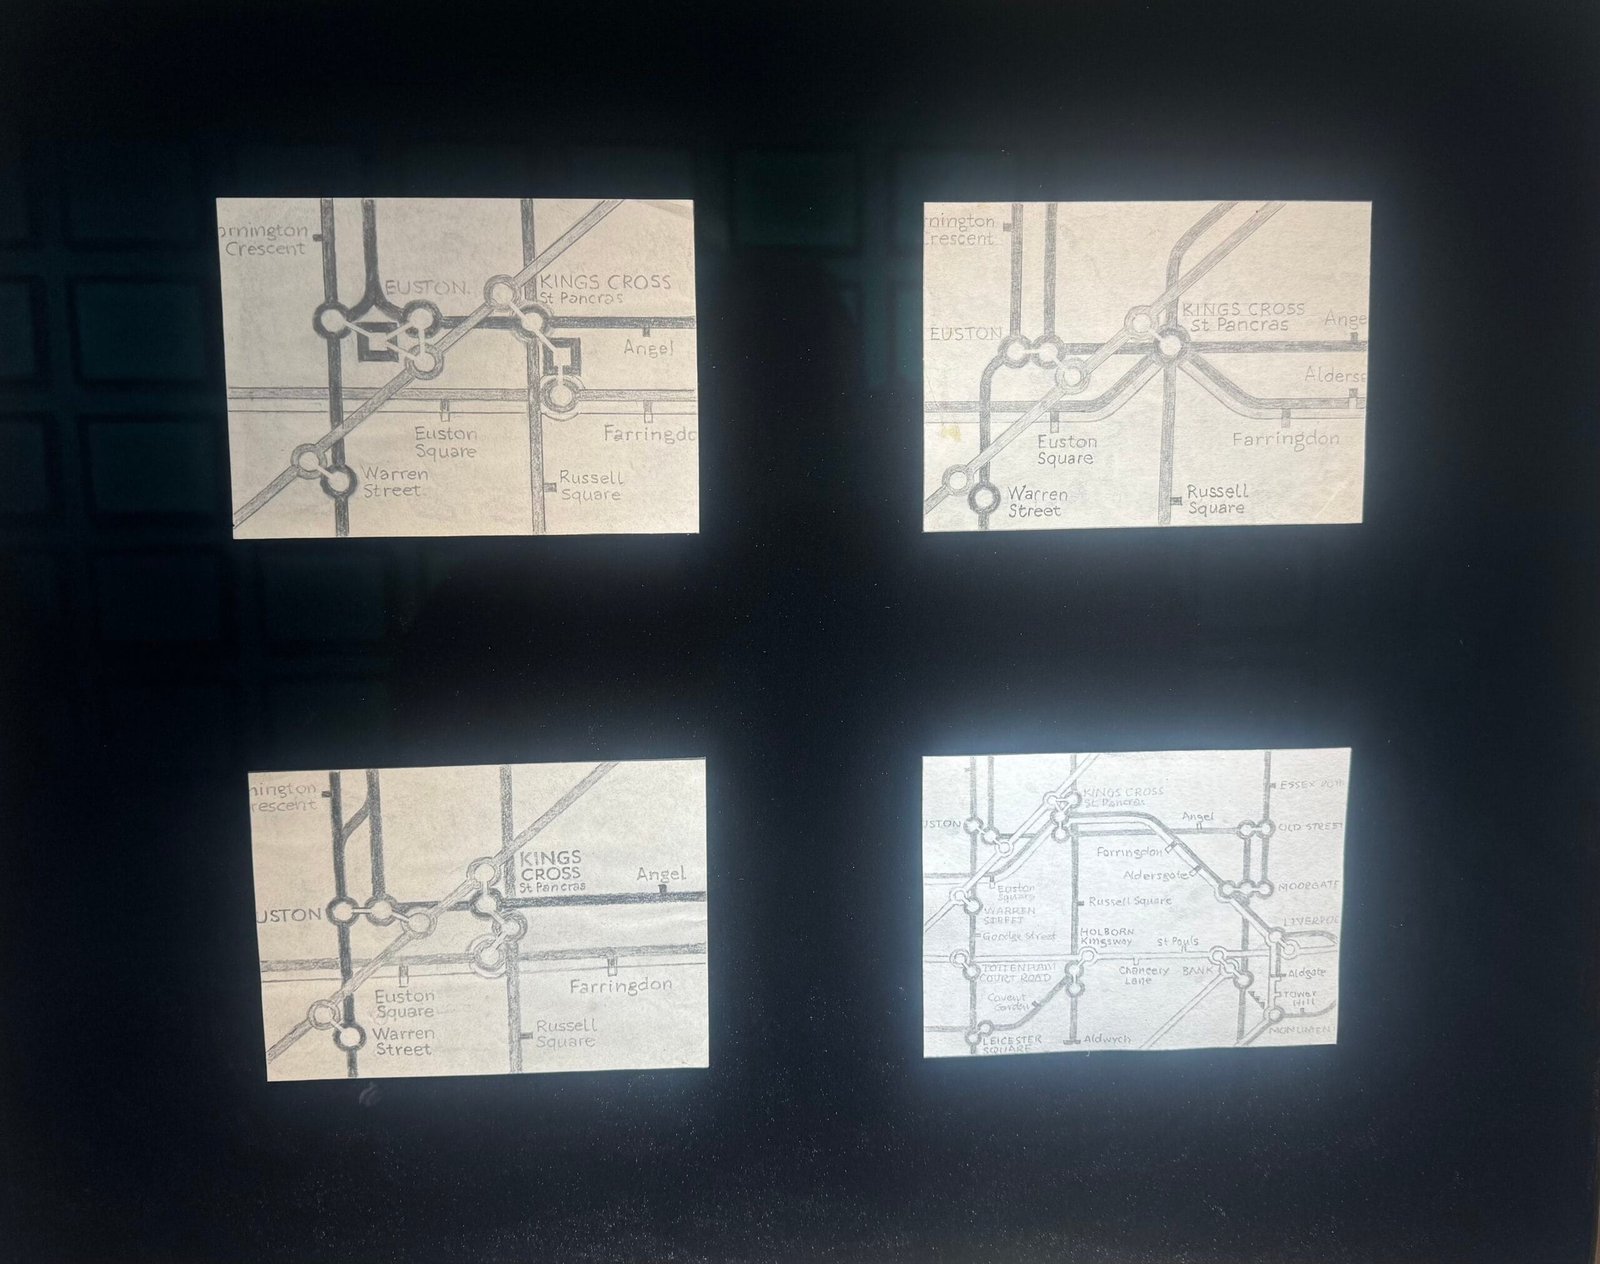

We went to see the exhibition of Tube Diagrams featuring some very early sketches by Harry Beck at the Map House in Knightsbridge (very, very pricey).
Victoria Line at Kings Cross and Euston
Four unique sketches in Harry Beck’s hand showing different ways to depict the area around Kings Cross and Euston when the Victoria Line was added to the diagram.
These sketches, drawn between 1961 and 1964, after Beck was unceremoniously ousted by London Transport, show his continued obsession with the design.
The first sketch (top-left) employs a design element which Beck had never used before: a square symbol for a mainline station interchange. As Beck never included this device on any of his other maps, we can suppose that he did not like this solution.The second sketch (top-right) uses a bend in the Circle and Metropolitan Lines at King’s Cross to allow for a tidier connection with the Victoria Line. This ‘hump’ reduces the number of interchange circles to two, allowing for a much tighter diagram. Here Beck uses capitalized station names to indicate an interchange with British Railways services instead of the square icon. Beck had never been permitted to mix upper-case and lower-case station names prior to 1960.
The third sketch (bottom-left) shows King’s Cross with four interchange circles and Euston with three. Beck’s use of coloured circles to indicate which lines intersect dates back to his first map of 1933, but this tradition had been axed by Beck’s replacement who favoured one black circle or square to indicate an interchange. This sketch includes one other unique design element – the curved line connecting the two branches of the northern line between Mornington Crescent and Euston.
The fourth sketch (bottom-right) is an outlier, showing much of the eastern Circle Line, and parts of the Central and Piccadilly Lines. Here Harry Beck grapples with two problems: the route of the Victoria Line and how it might affect the eastern curve of the Circle Line. This sketch proposes a solution which never appears on a finished map, but was inspired by Paul Garbutt’s bottle-shaped Circle Line.
This remarkable set of sketches show the evolution of Harry Beck’s thinking about the addition of the Victoria Line and his continuing effort to improve the design after 1960.
-
sur Markus Neteler: GRASS GIS 8.4.1RC1 released
Publié: 13 February 2025, 12:07am CET
The GRASS GIS 8.4.1RC1 release provides more than 70 improvements and fixes with respect to the release 8.4.0. Please support us in testing this release candidate.
The post GRASS GIS 8.4.1RC1 released appeared first on Markus Neteler Consulting.
-
sur Mappery: Show Some Love, Keep It Clean
Publié: 12 February 2025, 12:00pm CET
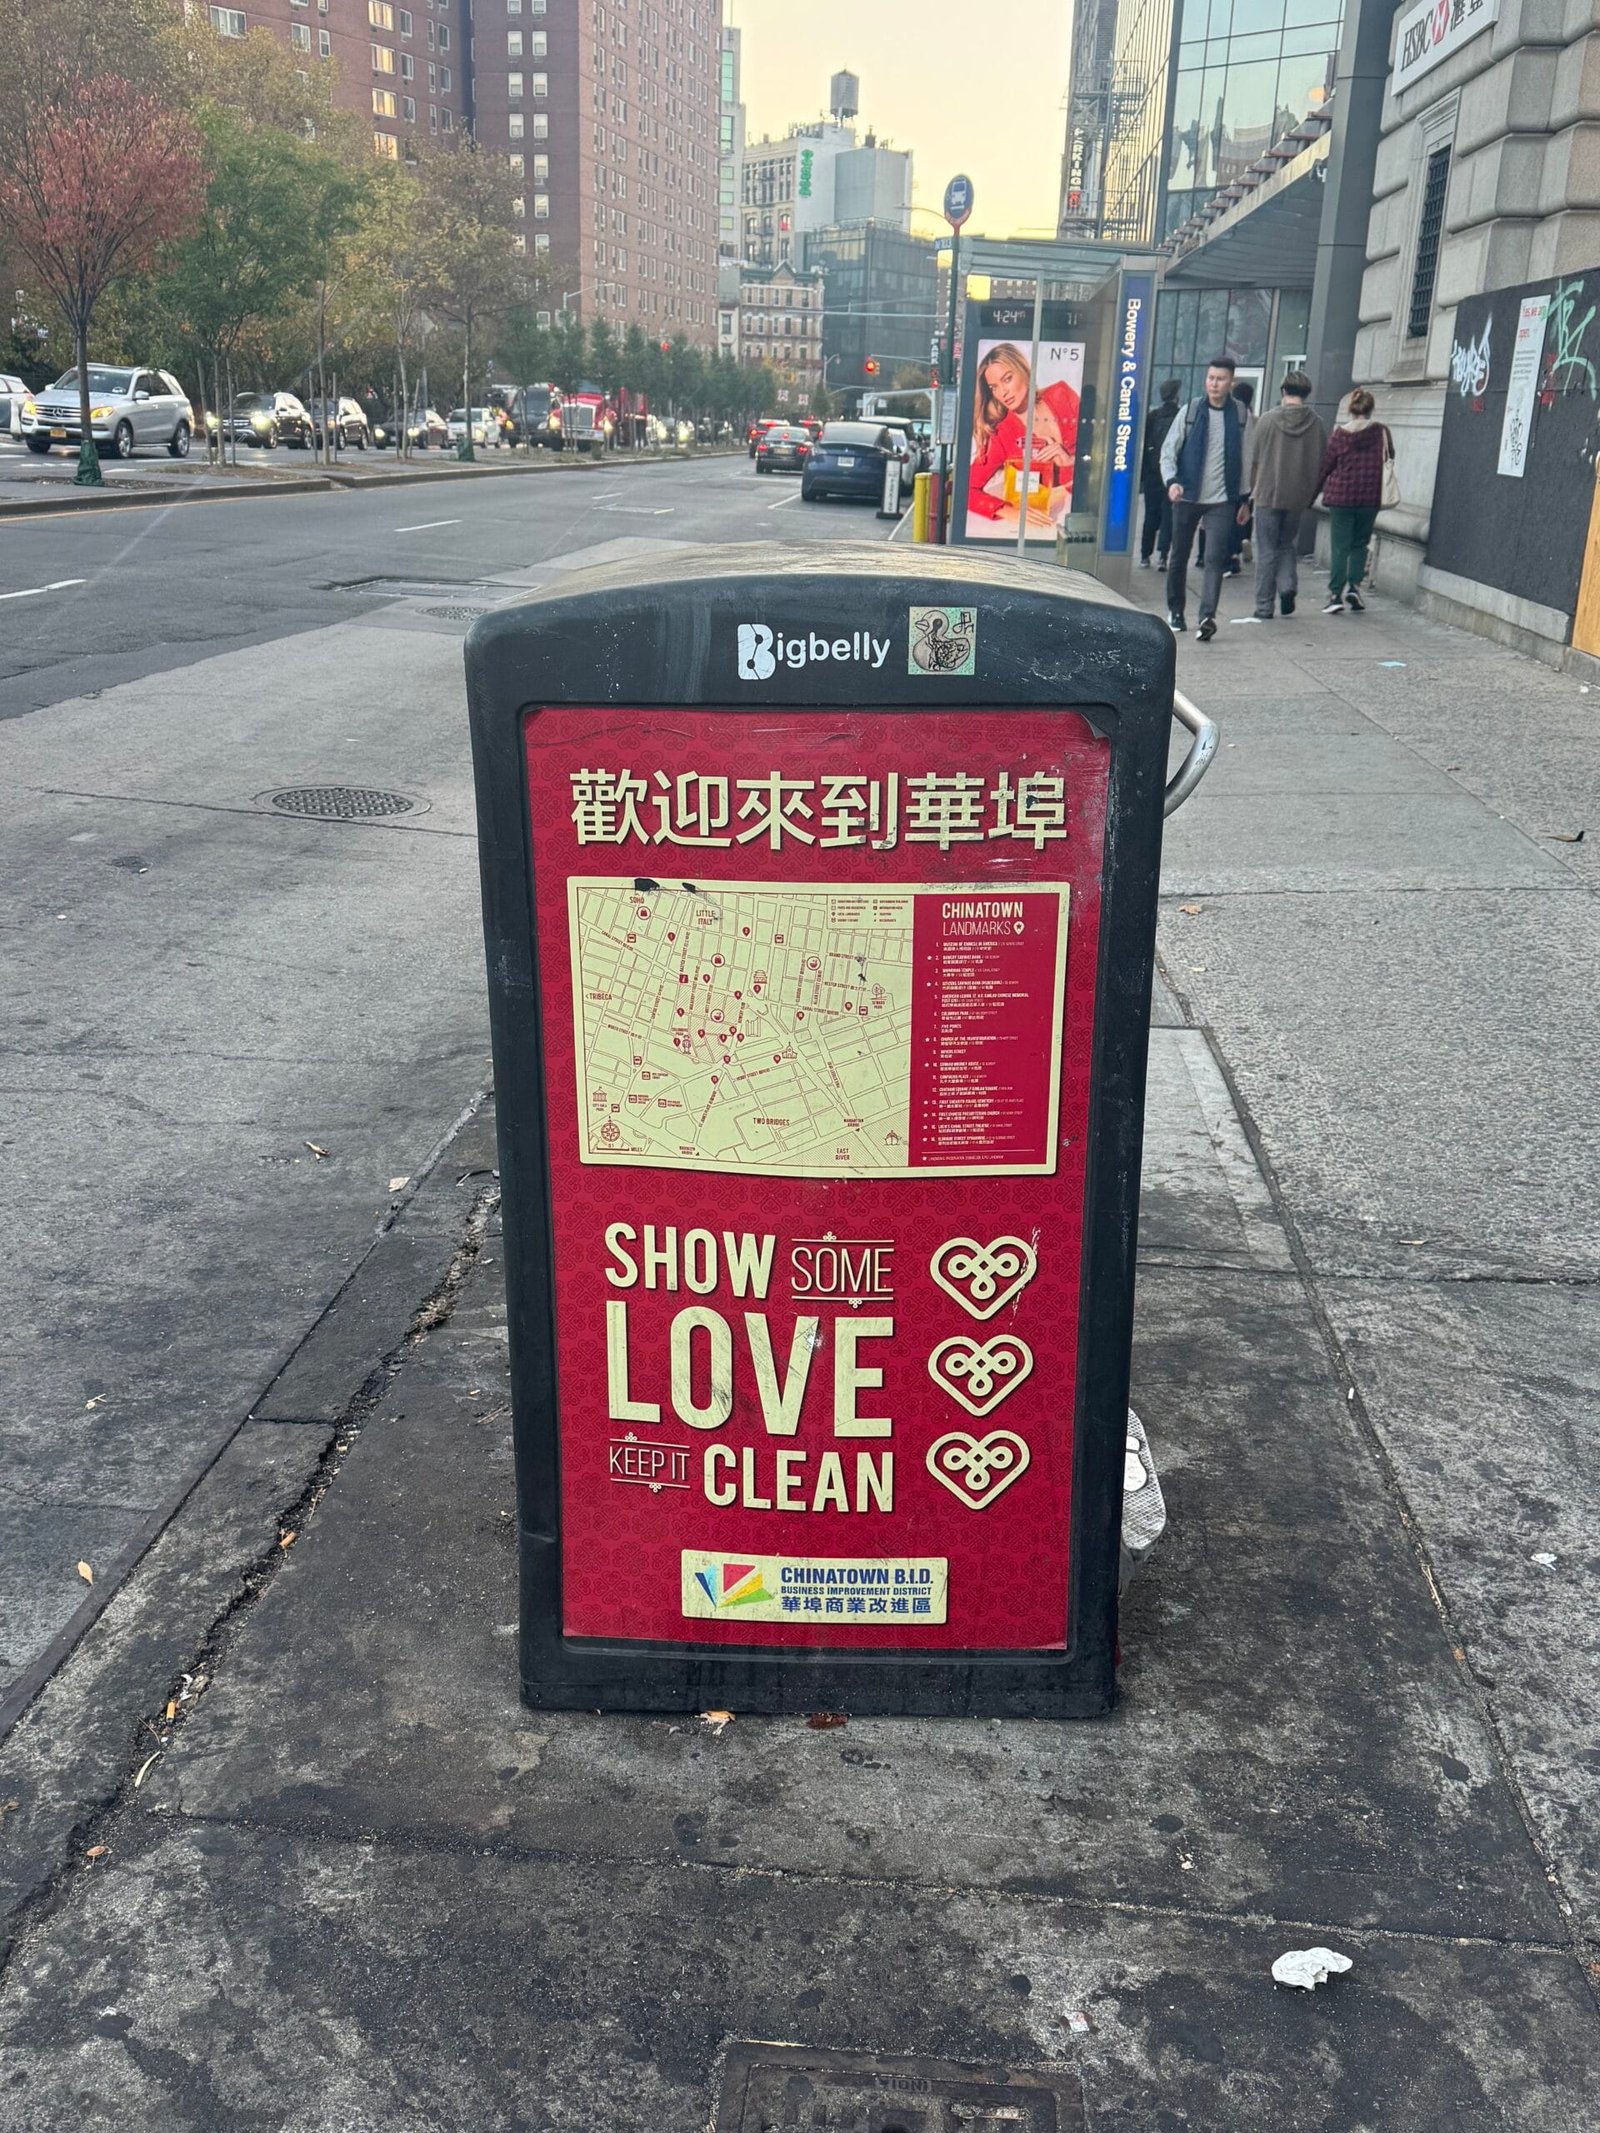
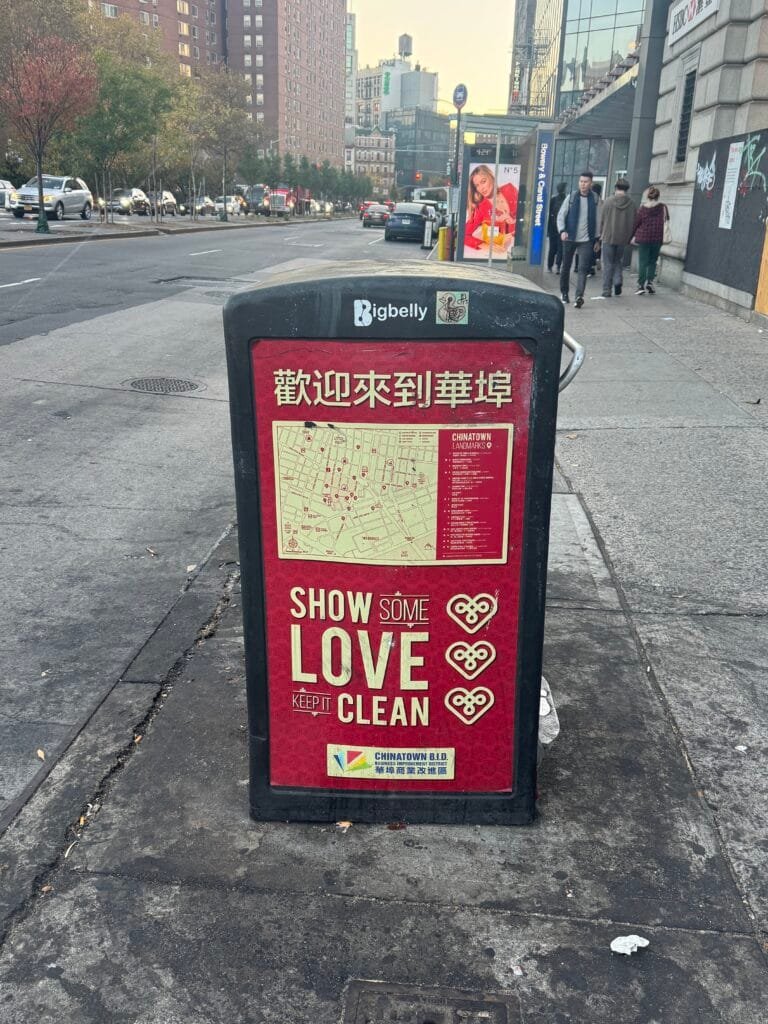
Spotted in Chinatown, NYC.
-
sur QGIS Blog: Plugin Update – January, 2025
Publié: 11 February 2025, 10:31pm CET
January, the first month of 2025, brought us 36 new plugins, published in the QGIS plugin repository.
Here follows the quick overview in reverse chronological order. If any of the names or short descriptions catches your attention, you can find the direct link to the plugin page in the table below:
OverviewGBIF Extractor Based on an extent, the user can download GBIF data. Transliterator A plugin to transliterate Georgian script to Latin. CARTO Seamless Cloud Data Warehouse Integration. Open Google Maps Opens current map extent in Google Maps. Planet Sandbox Plugin Plugin to explore Planet’s Sandbox data from the Planet Insights Platform. Right now it only displays a single layer, but makes it easy to see where the data is. This plugin will expand functionality in future versions. QSFCGAL This plugin integrates SFCGAL functions into the QGIS Processing toolbox and expressions for advanced spatial analysis. Sampling Time Performs multiple sampling methods on shapefile layers. Layer Reverse Reverse order of highlighted layers. PointCloudFR Downloads LiDAR tiles from IGN that intersect with the input AOI. Layer CRS Shifter Coordinate System Shift for Layer. Connector for ODK Connect to ODK Central, fetch submissions, and visualize field data on QGIS maps. Supports filtering, spatial analysis, and data export. TeamArea Creator Create 3 Layers for each Team, Collecting Things like garbage and trace their route. Export collectionMarks to Excel. Lateral spreading Lateral spreading for seismic microzonation. WMS CQL Filter to QGIS Server Filter Request Transforms CQL_FILTER WMS request to a QGIS server compatible FILTER request. WQICalculator WQICalculator is a QGIS plugin that allows automatic calculation of the Water Quality Index (WQI) using raster data of various physicochemical parameters as input. Elasticsearch Loader Connects to an Elasticsearch index, executes a query, and loads the results as a QGIS layer. Sankalan 2 Tool for transferring data from and to Sankalan 2.0 Mobile App for field survey. Layer Color Plugin This plugin enables users to customize the background colors of layers and groups in the layer tree view, enhancing visual organization and project management. Seismic microzones with morphological gradient This plugin identifies areas with a morphological gradient with slopes ?15° within seismic zones (input vector file) starting from the DTM. Raster Stats Plus Calculates detailed statistics of a selected raster layer, allows you to choose the band via a menu, and generates histogram and Gaussian curve plots. Landsklim Spatial interpolations from quantitative data. RGD Savoie Mont Blanc Plugin Plugin QGIS fournissant un accès simple aux flux de données géographiques du GIP RGD Savoie Mont Blanc et d’autres ressources géographiques utiles aux acteurs publics de Savoie et de Haute-Savoie ( plan cadastral, photographies aériennes, données d’urbanismes, cartes topographiques, données alimétriques, PCRS…). Fonctionnalités de recherche et consultation de données cadsatrales. Recherche d’adresse postale. Veuillez noter qu’un certain nombre de services accessibles par le plugin nécessitent d’avoir un accès autorisé accordé par la RGD Savoie Mont Blanc. info@rgd.fr pour toute création de compte. TeleProp Radio Propagation Fieldstrength AfpolGIS Data Connector This plugin allows you to load geospatial data from several Data Platforms; OnaData, ODK, KoboToolbox, ES World, GTS and DHIS. GeoFlight Planner A versatile QGIS plugin for drone flight planning, ensuring optimized flight paths and high-quality data capture. Geology from points and lines Geoprocessing plugin to generate polygons and lines from lines and points with geological information. Census Downloader Downloads Census Data. FeaturesBoundingBox Show the BBox info for the selected features. Raster Reclassifier Reclassification of the raster layer using a table of range values ??extracted directly from the raster band, or defined directly by the user. The histogram of the raster is shown, reflecting the distribution of values ??within the minimum and maximum range of the selected reference band. Available languages: English, Italian and Spanish. ***ITALIANO*** Riclassificazione del layer raster tramite una tabella di valori di intervallo estratti direttamente dalla banda raster, oppure definiti direttamente dall’utente. Viene mostrato l’istogramma del raster, che riflette la distribuzione dei valori all’interno dell’intervallo minimo e massimo della banda di riferimento selezionata. QBeachball Easily plot focal mechanisms (beachballs) onto a map. argentina_georef Obtiene información administrativa de Argentina a partir de coordenadas. Stara Maps Plugin para organizar arquivos de agricultura de precisão, facilitando a organização de mapas e arquivos em geral. NL wfs_loader Deze plugin laad publiek beschikbare, maar lastig vindbare, WFS lagen. Polygon Labeler Automatically generate and label polygons with custom names, and add the labels as a new attribute field to the attribute table. ahp_application This QGIS plugin implements the Analytic Hierarchy Process (AHP) for suitability analysis. Geospatial Gateway – GeospatialCloudServ and Tile Server Connection This plugin requires the purchase of either Windows Tile Server [https:]] or Ready to Go Cloud or On-Prem/Edge Virtual Machine Solution [https:]] -
sur GRASS GIS: GRASS GIS App for Mac now notarized
Publié: 11 February 2025, 5:00pm CET
The GRASS Development Team is pleased to announce that the prebuilt applications for macOS are now signed and notarized. This enhancement represents a significant improvement in both security and user convenience. The currently available notarized binaries include the preview version 8.5.0dev and the release candidate 8.4.1. These versions are bundled with essential software components, including GDAL 3.10.1, PDAL 2.8.3, PROJ 9.5.1, and Python 3.12. Future releases will also be signed and notarized to ensure continued security and compliance. -
sur Mappery: GRAB
Publié: 11 February 2025, 12:00pm CET

Using Satellites for Spying
GRAB (Galactic Radiation and Background) Satellite Ground
Station Contact Map, 1960GRAB was the first electronic spy satellite; it picked up radio communications from Cold War adversaries. Ground operators used this map to tell when the satellite was overhead. That’s when they could download intercepted intelligence.
This is the last post from my visit to the National Air and Space Museum in Washington, it’s a must see if you are in the city.
-
sur Nick Bearman: tmap version 4 released!
Publié: 11 February 2025, 2:00am CET
tmap version 4 has now been released, and is now available on CRAN. It has a whole range of new features, which we will explore in this blog post.
If those words above mean nothing to you, a quick recap:
tmapis a library used in R to make maps. I use it in my Introduction to Spatial Data and Using R as a GIS training course so if you have attended one of those, you have already used it. If you are interested in learning more, check out my Training Courses or my Training Materialstmap’s maintainer, Martijn Tennekes, has been working on v4 for a number of years, and has quite a few changes under the hood.
From our point of view (people who are new-ish to R, and/or
tmap) the code to make maps has changed slightly. Martijn has put in a lot of ‘helper’ information for people transitioning from v3 to v4, so all your code will still work.For basic maps,
tmap v3:qtm()hasn’t changed at all; although you will notice that the defaults have changed:qtm(sthelens, fill="Burglary")
tmap v4: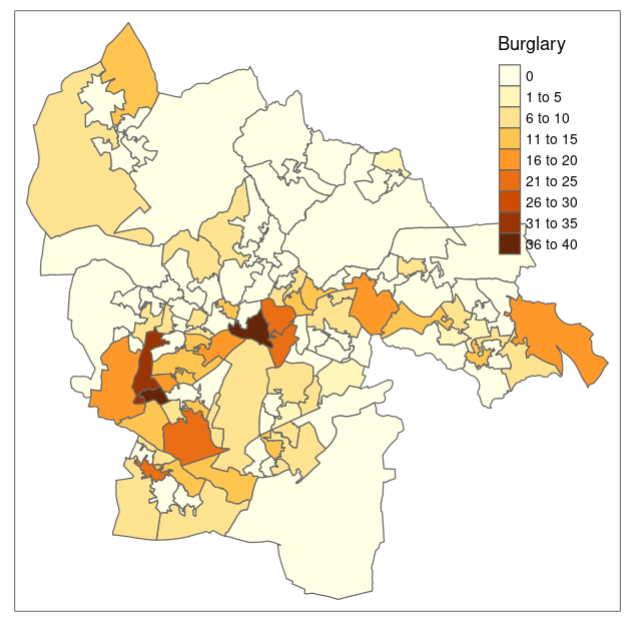
qtm(sthelens, fill="Burglary")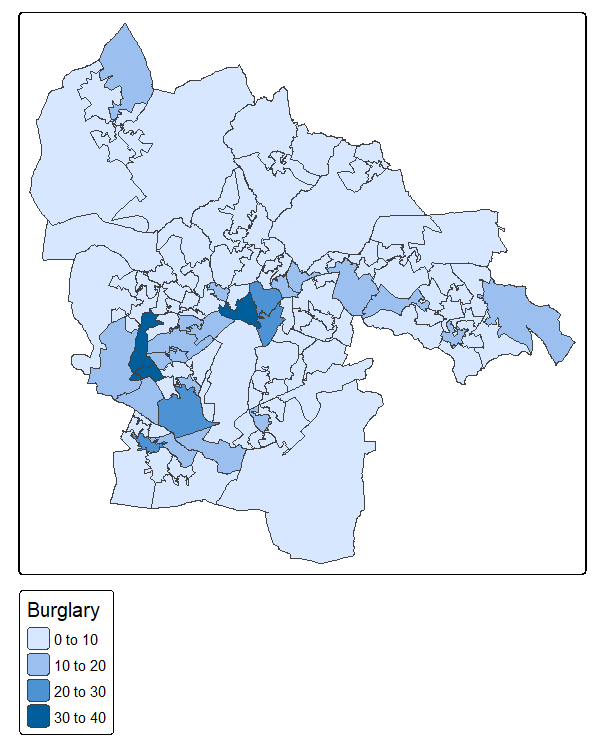
Similarly,
tm_shapeandtm_polygonsare the same for a basic map, but again the defaults have changed.However, when you get to doing slightly more advanced things with
tm_shape, for example specifying colours, the code has changed slightly:tmap v3:
tm_shape(LSOA) +
    tm_polygons("Age00to04", title = "Aged 0 to 4", palette = "Greens", style = "jenks") +
    tm_layout(legend.title.size = 0.8)
tmap v4:
  tm_shape(LSOA) +
    tm_polygons(fill = "Age00to04",
                fill.scale = tm_scale_intervals(values = "brewer.greens", style = "jenks"),
                fill.legend = tm_legend(title.size = 0.8))
One specific thing of note is that there is a much wider selection of colour pallets available than the Brewer pallets. As such, we now need to specify
brewer.greensrather than justGreens. However we do get a handy note if we forget:[cols4all] color palettes: use palettes from the R package cols4all. Run `cols4all::c4a_gui()` to explore them. The old palette name "Greens" is named "brewer.greens" Multiple palettes called "greens" found: "brewer.greens", "matplotlib.greens". The first one, "brewer.greens", is returned.
Martijn has designed the library to be backwards compatible, and if you do try using some v3 code with v4, it will still run and create your map, and give you some handy advice:
tm_shape(LSOA) +
   tm_polygons("Age00to04", title = "Aged 0 to 4", palette = "Greens", style = "jenks") +
   tm_layout(legend.title.size = 0.8)

?? tmap v3 code detected ????????????????????????????????????????????????
[v3->v4] `tm_polygons()`: instead of `style = "jenks"`, use fill.scale =
`tm_scale_intervals()`.
? Migrate the argument(s) 'style', 'palette' (rename to 'values') to
  'tm_scale_intervals(<HERE>)'
[v3->v4] `tm_polygons()`: migrate the argument(s) related to the legend
of the visual variable `fill` namely 'title' to 'fill.legend =
tm_legend(<HERE>)'
Additionally, when dealing with the layout, legend and so on, things are a bit different:
tmap v3:
  tm_shape(LSOA) +
    #Set colours and classification methods
    tm_polygons("Total", title = "Total Population", palette = "Greens",
                style = "equal") +
    #Add scale bar
    tm_scale_bar(width = 0.22, position = c(0.05, 0.18)) +
    #Add compass
    tm_compass(position = c(0.3, 0.07)) +
    #Set layout details
    tm_layout(frame = F, title = "Liverpool", title.size = 2,
              title.position = c(0.7, "top"))
tmap v4:
  tm_shape(LSOA) +
    #set column, colours and classification method
    tm_polygons(fill = "Age00to04",
                fill.scale = tm_scale_intervals(values = "brewer.greens", style = "jenks"),
                fill.legend = tm_legend(title = "Aged 0 to 4", size = 0.8)) +
    #add scale bar
    tm_scalebar(position = c(0.1, 0.1)) +
    #north arrow
    tm_compass(size = 1.5, position = c(0.1, 0.3)) +
    #Set title details
    tm_title("Total Population of Liverpool, 2021")
All of this redesign is in aid of better flexibility. For example, in v3 we were limited to
tm_polygons(),tm_lines(),tm_symbols(), andtm_raster()(and their derivatives such astm_borders()andtm_dots()). But with v4, these are easily extendible - so we can have things liketm_cartogram(),tm_donuts()and so on. Many of these are still in development but it opens up a much wider range of options.In terms of how we show maps, v3 had
plotandviewmodes, but this new framework makes it possible to add other modes as well.Equally, tmap is based on
sfandstars, but the new framework will make it easier to work with other spatial classes, such asSpatRasterandSpatVectorfromterra.A nice overview for those already familiar with tmap is at [mtennekes.github.io] (originally posted in 2021). The website also had a new range of tutorials under Basics and Advanced which are in the process of being developed.
The fact the tutorials (and the whole website) are built using
pkgdownmeans that it is very easy to open the relevant page on GitHub and make changes. For example, I added a fixed breaks example to the Basic Scales page.This also featured at the FOSS4G Code Sprint (Brazil) where Andrés Duhour and I updated the ggplot2 comparison article.
Tennekes M (2018). “tmap: Thematic Maps in R.” Journal of Statistical Software, 84(6), 1–39. doi:10.18637/jss.v084.i06.
If you want to learn how to use
tmap, do have a look at my Introductory or Advanced GIS training in R, or if you have any questions, please do contact me. -
sur Paul Ramsey: The Early History of Spatial Databases and PostGIS
Publié: 10 February 2025, 6:00pm CET
For PostGIS Day this year I researched a little into one of my favourite topics, the history of relational databases. I feel like in general we do not pay a lot of attention to history in software development. To quote Yoda, “All his life has he looked away… to the future, to the horizon. Never his mind on where he was. Hmm? What he was doing.”
Anyways, this year I took on the topic of the early history of spatial databases in particular. There was a lot going on in the ’90s in the field, and in many ways PostGIS was a late entrant, even though it gobbled up a lot of the user base eventually.
-
sur Mappery: The World from Space in 1950
Publié: 10 February 2025, 12:00pm CET
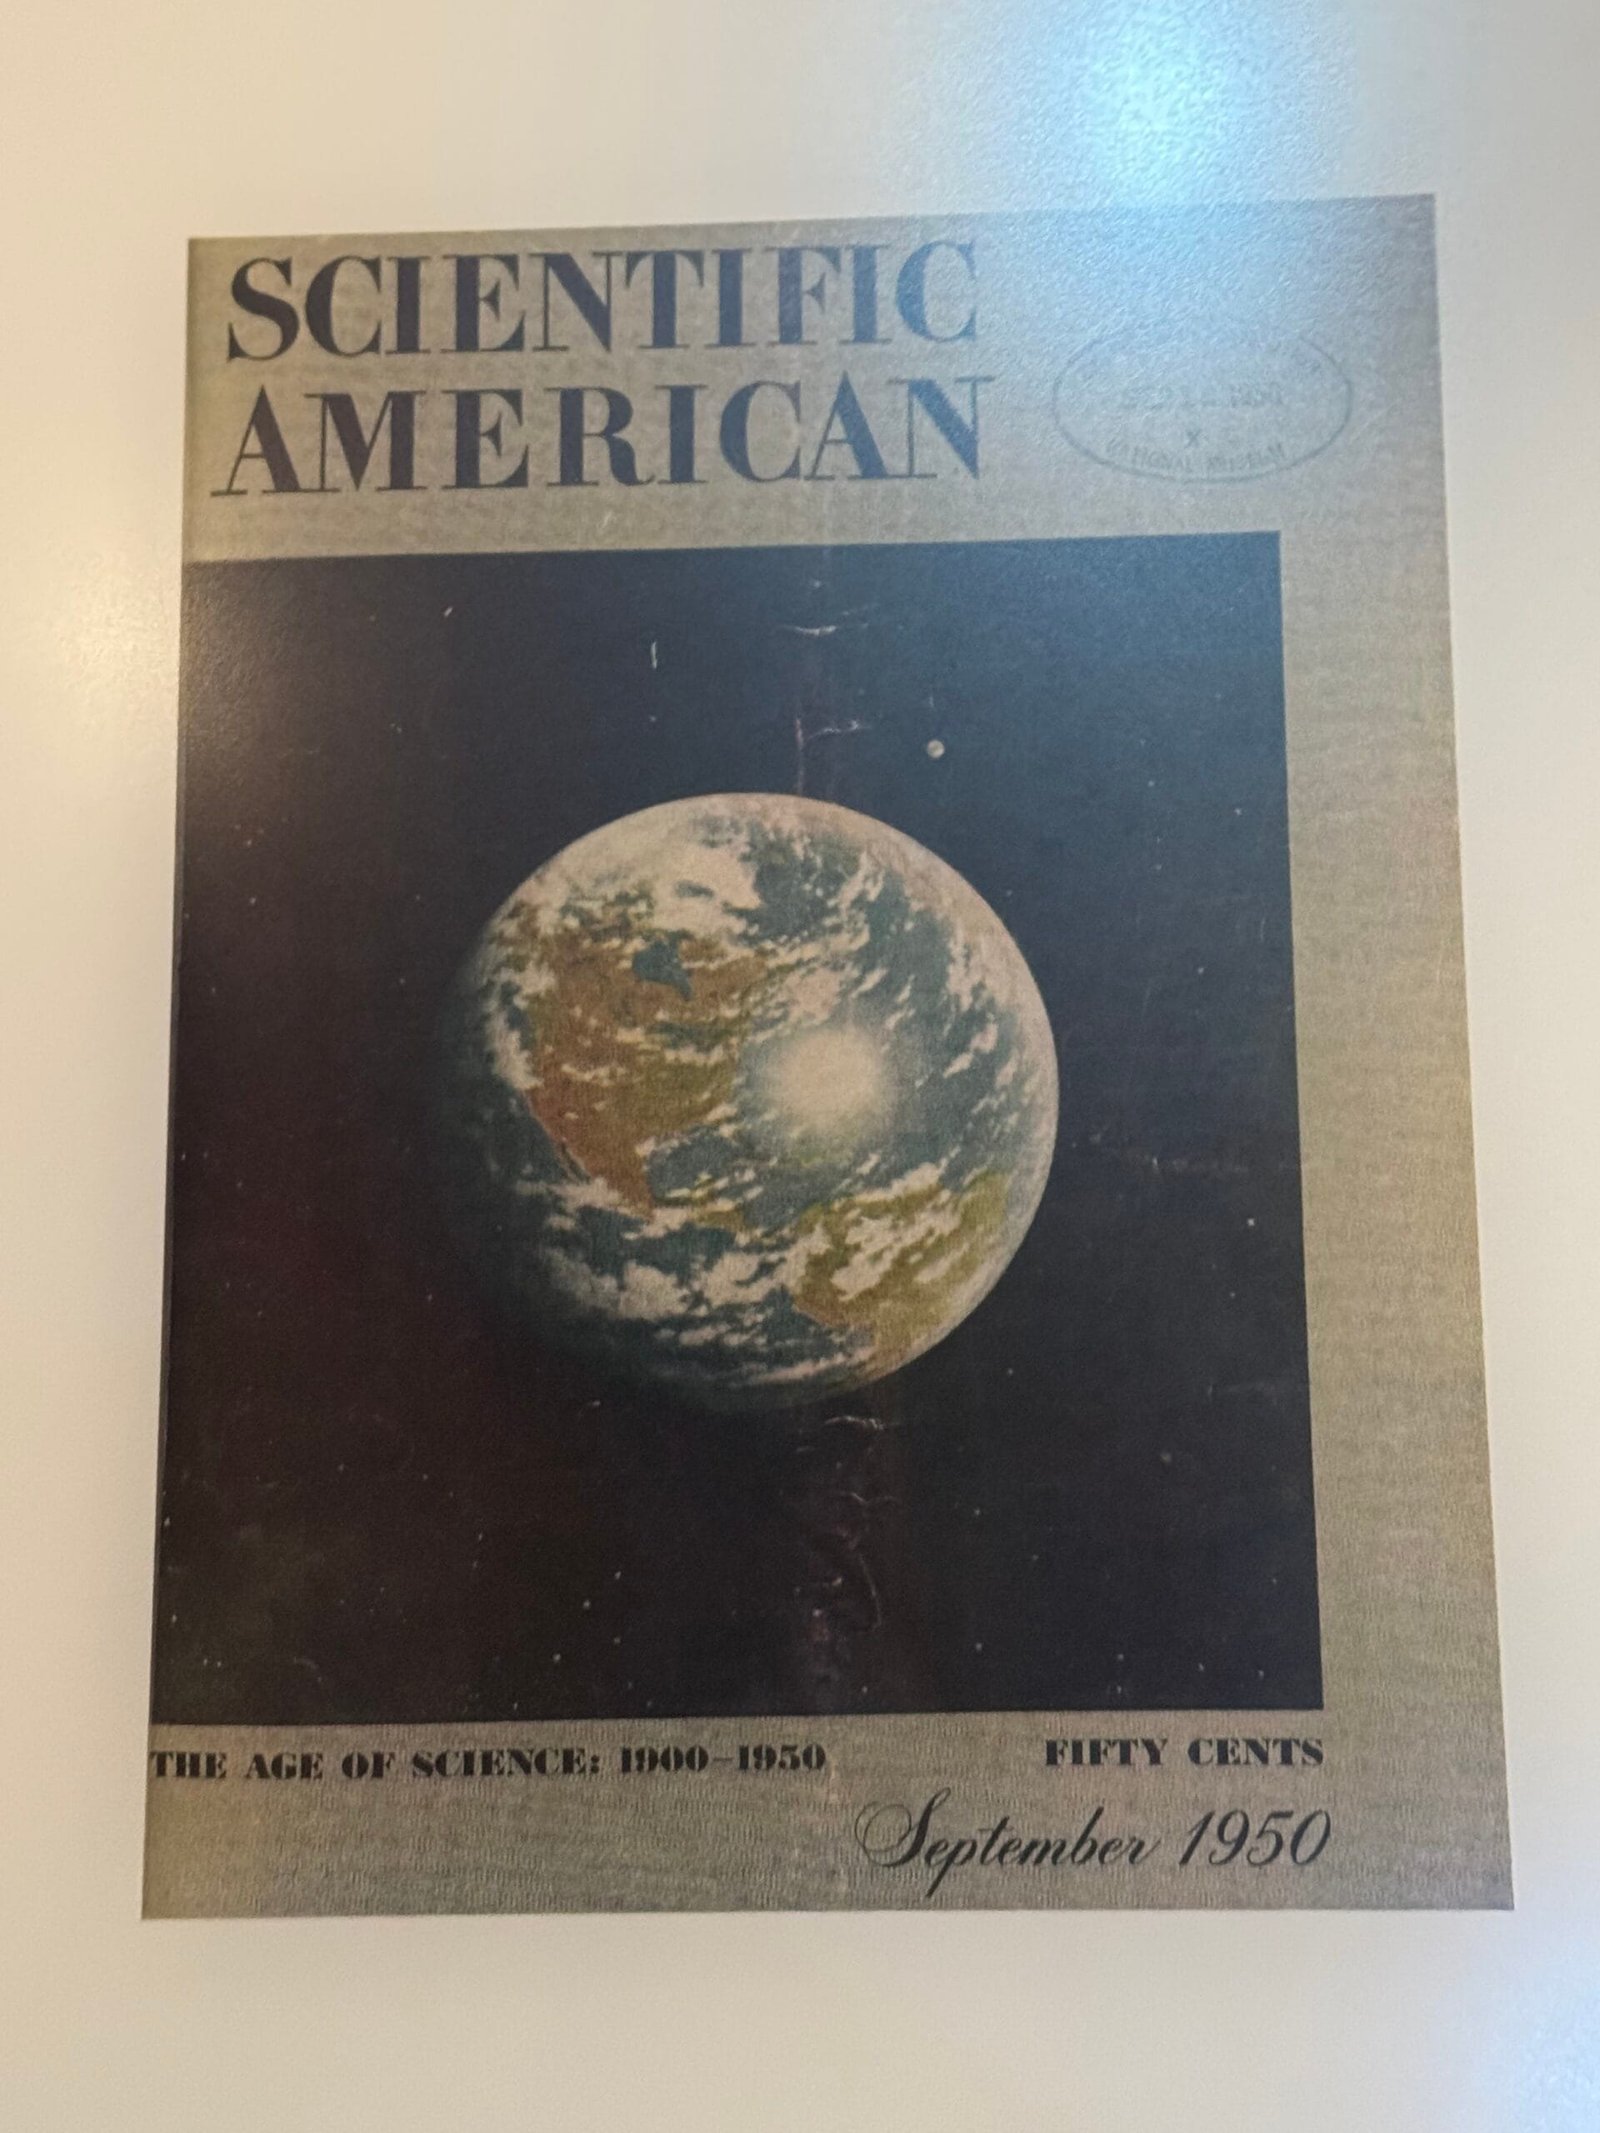

Picturing Earth from Space
Before the Space Age, people could only imagine what Earth looked like. Artists tried their best, and in time, new technologies started to piece together a more accurate picture. High-altitude rockets, satellites, and human space missions gave us increasingly dramatic views.
In 1950, Scientific American had to rely on artist Chesley Bonestell’s conception of Earth as seen from space, not on an actual photograph. -
sur Mappery: Operation Moon Bounce
Publié: 9 February 2025, 12:00pm CET

Another one from the Air and Space Museum.
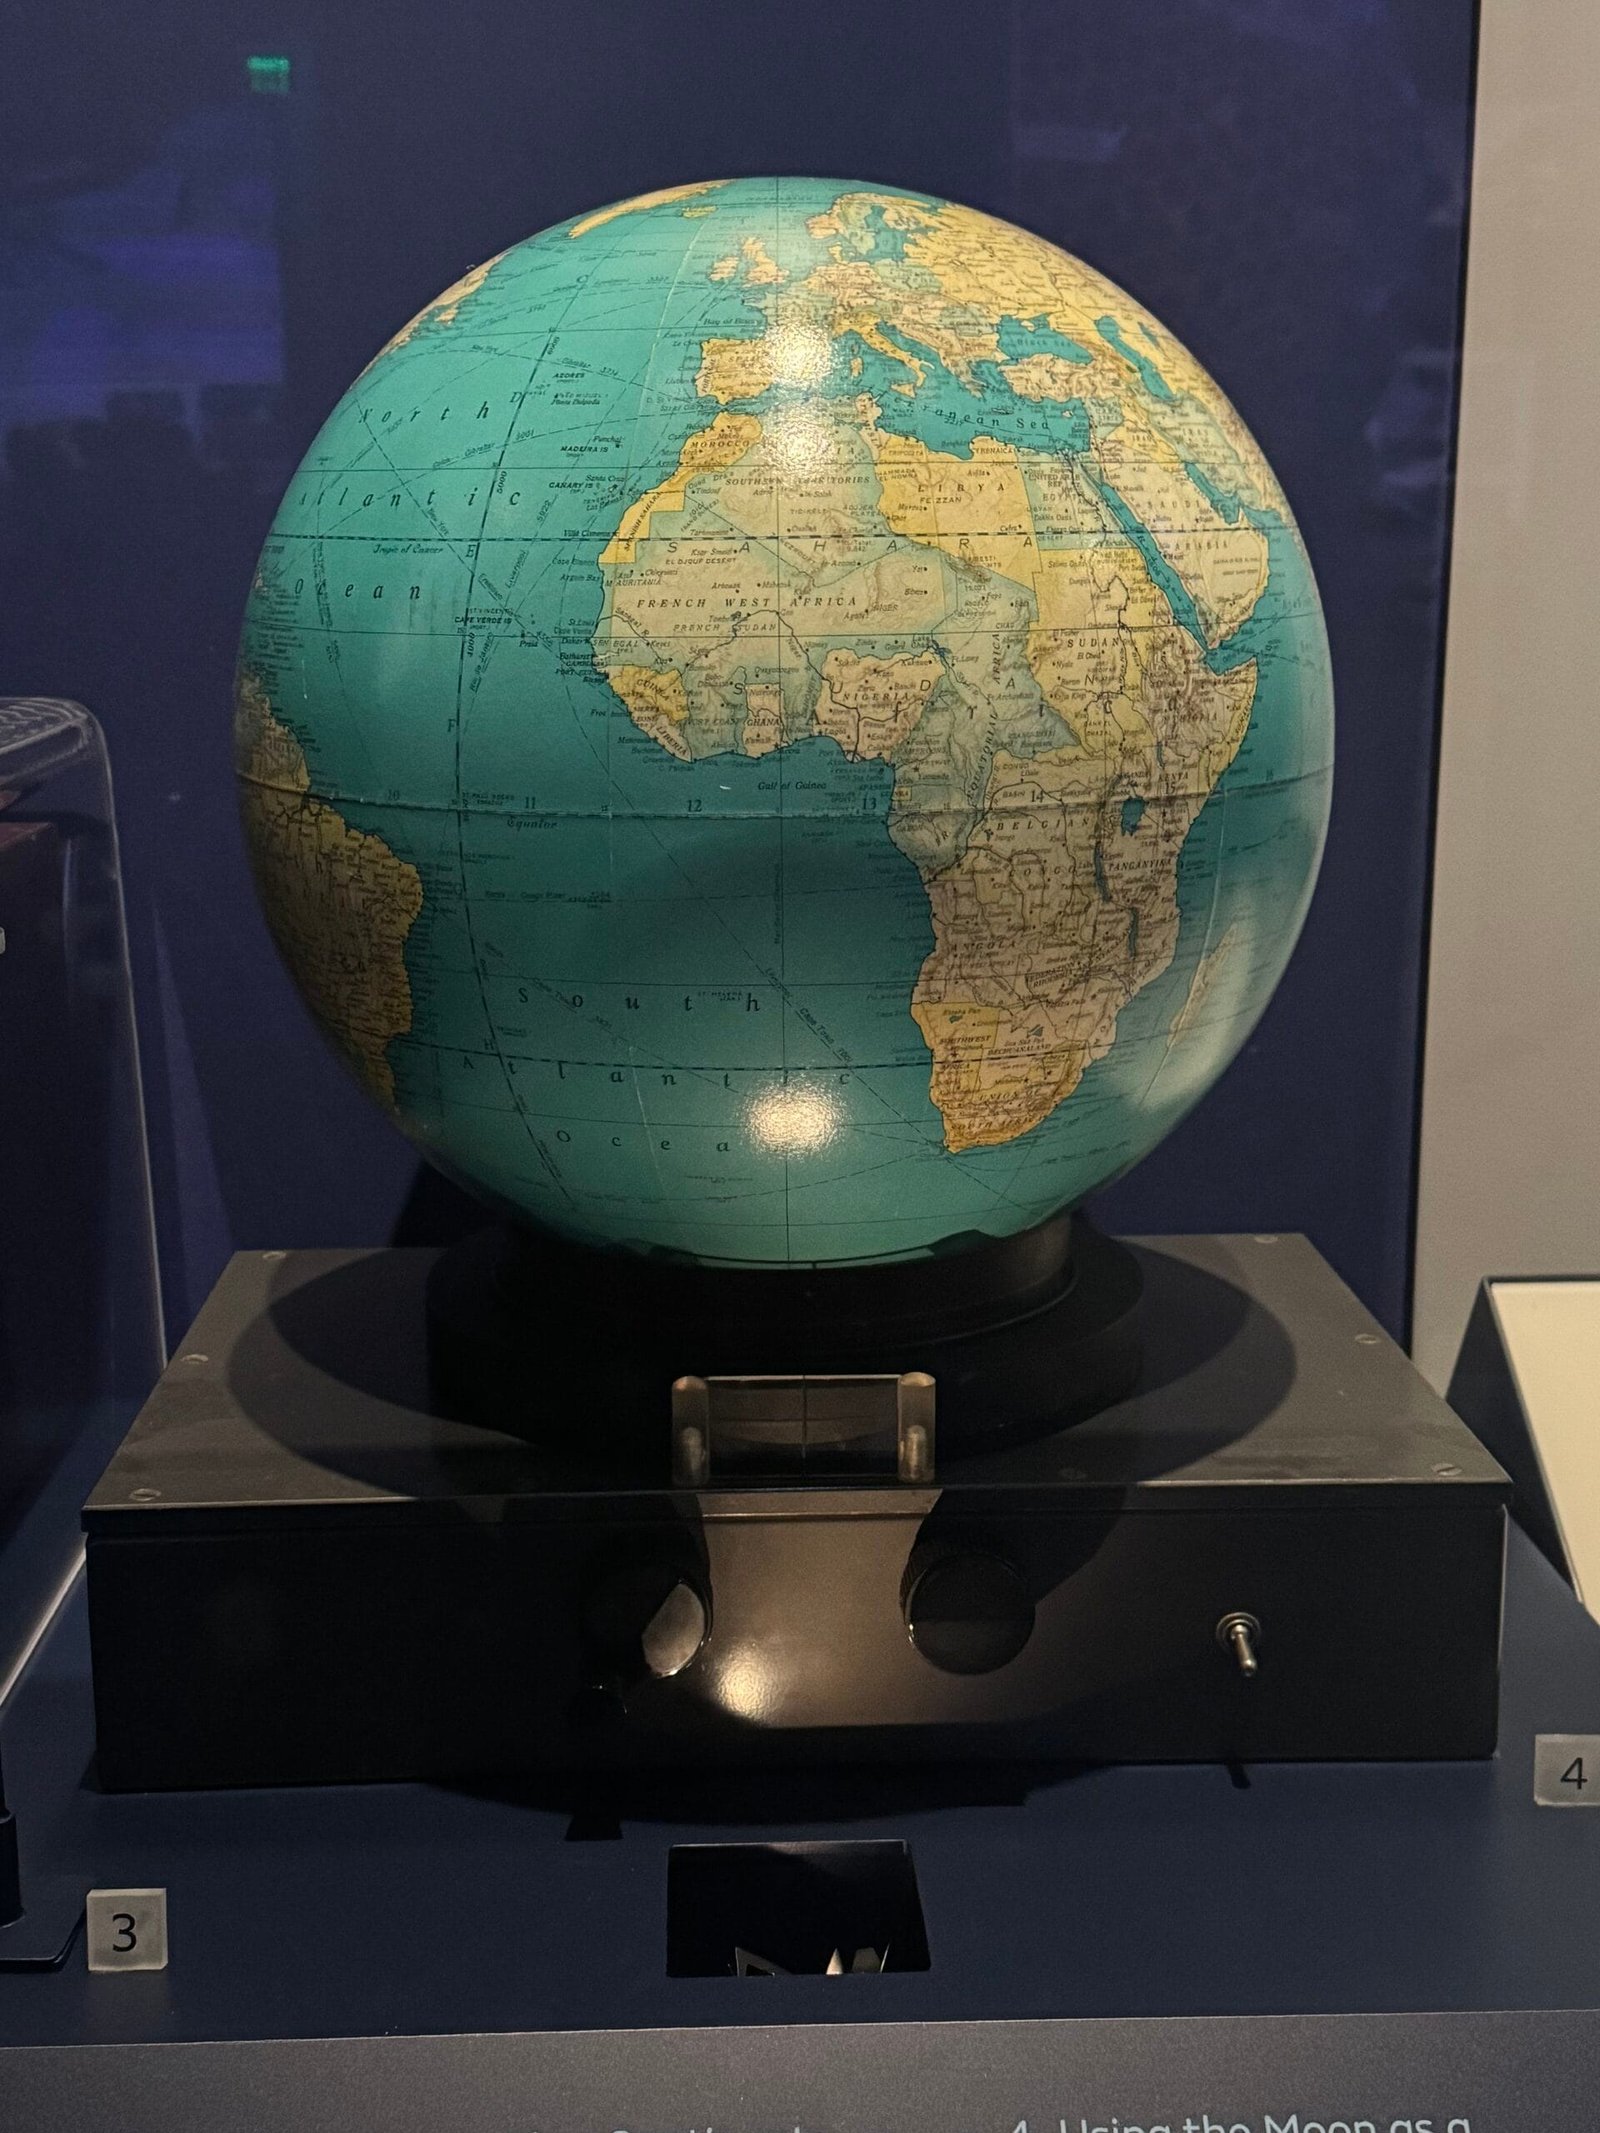
Using the Moon as a Communications Satellite
The U.S. Navy’s Operation Moon Bounce beamed radio signals to the Moon that bounced back to another location on Earth. This system made it easier for the military to send long-distance messages during the Cold War. This lighted globe helped radio operators see which half of the Earth was facing the Moon— showing when and where moon-bounce messages could be sent.
-
sur QGIS Blog: QGIS recognized as Digital Public Good
Publié: 8 February 2025, 2:05pm CET
We are thrilled to announce that QGIS has been officially recognized as a Digital Public Good (DPG) by the Digital Public Goods Alliance (DPGA)! This recognition underscores our commitment to open-source geospatial solutions that contribute to the advancement of the United Nations Sustainable Development Goals (SDGs).
What is a Digital Public Good?A Digital Public Good is a digital solution that meets the DPG Standard, ensuring that it is open-source, respects privacy, adheres to best practices, and contributes to sustainable development. The DPGA is a multi-stakeholder initiative dedicated to fostering the discovery, development, and implementation of digital solutions that address global challenges such as climate change, public health, and equitable access to technology.
Why is this important for QGIS?Being recognized as a Digital Public Good highlights our:
- Alignment with SDGs, supporting sustainable development by enabling environmental monitoring, disaster management, urban planning, and more.
- Commitment to open-source principles, ensuring transparency, collaboration, and accessibility.
- Independence & accessibility, empowering users without restrictions, across different operating systems, and in a multitude of languages (even more than can be listed on the DPG Registry page).
- Privacy & security, adhering to best practices in data protection and governance.
Being recognized as a DPG strengthens our global reach and impact, opening doors for further collaborations with governments, NGOs, and educational institutions looking for robust and free geospatial tools. It also reaffirms our dedication to building an open, inclusive, and innovative GIS ecosystem that serves communities worldwide.
Learn moreYou can find QGIS listed in the Digital Public Goods Registry here. We encourage all members of our community to share this great news and continue contributing to the growth of QGIS!

We would like to particularly thank Enrico Ferreguti for taking the initiative and preparing the application for the QGIS project.
-
sur Mappery: Satellite Communications
Publié: 8 February 2025, 12:00pm CET


Saw these in the Air and Space Museum, can’t quite remember the story behind them but I think it is to do with satellite communications for internet (somebody correct me please). Regardless, this is a massive globe with lights and lines and I thought it was cool.

-
sur QGIS Blog: Reports from the winning grant proposals 2024
Publié: 7 February 2025, 6:25pm CET
With the QGIS Grant Programme 2024 (Updates #1 & #2), we were able to support 7 enhancement proposals that improve the QGIS project. The following reports summarize the work performed:
- QEP#269 Update older annotation items to new framework — report
This enhancement introduced new annotation types, improved callout options, and a rich text editor for better formatting. Annotations can now link to a “visibility layer,” and older types are automatically upgraded for a cleaner UI. Future improvements may include handling HTML annotations, deprecating the “Form” annotation, and refining the user experience. - QEP#289 Authentication system revision (v1.1) — report
This work enhances the authentication framework by automating password synchronization with the system keychain and generating secure default passwords for new profiles. Users now experience a smoother setup with fewer manual steps, while UI tweaks improve password handling and security. These changes provide a more seamless and secure experience for both users and plugin developers. - QEP#291 Mitigate Abusive Tile Fetching on OpenStreetMap (OSM) — report
This work enhanced network caching by dynamically adjusting cache size based on available disk space, significantly improving tile storage for most users. New safeguards prevent accidental breaches of OpenStreetMap’s tile usage policy by limiting bulk downloads across various tools and warning users when thresholds are exceeded. Additionally, the default OpenStreetMap XYZ layer now uses a 96DPI tile resolution, reducing unnecessary tile requests and improving print layout exports. These changes help ensure responsible data usage while enhancing performance and usability. - QEP#287 PyQGIS linter warnings — report
This work enhanced QGIS’s Python integration by contributing upstream, directly to SIP. This approach avoids extra build-time complexity. In addition to static linting, support for deprecation messages was added, now active in QGIS (requires Python-SIP 6.9.0 or later). Due to budget constraints and dependency availability, planned updates to the plugin platform needed to be postponed. - QEP#290 Clean up point cloud index and improve its thread safety — report
This work enhanced point cloud support by providing shared pointer access to the point cloud index, cleaning up the point cloud index API, unifying local and remote implementations of EPT/COPC providers, and refining hierarchy fetching logic. These updates make point cloud handling more robust and better prepared for future use cases. - QEP#292 Implementing CI Qt6 Windows Builds through vcpkg — report
This enhancement focused on transitioning QGIS to build with Qt6 using vcpkg, streamlining dependency management and improving the Windows development experience. Continuous integration pipelines now test Qt6 builds, helping identify compatibility issues early. Additional contributions include improved build documentation, enhanced dependency tracking, modernized CMake scripts, and updates to the pull request comment bot. Preliminary work has also begun on macOS support using the same vcpkg system. These efforts lay the groundwork for a smoother Qt6 migration and long-term maintainability. - QEP#248 Authentication System: allow Database storage for authentication DB — report
This enhancement introduced a new API for managing authentication credentials in QGIS. While its immediate impact on users is limited, it addresses SQLite scaling issues for QGIS Server in cloud environments and lays the foundation for future enhancements. The update includes an abstraction layer for third-party credential storage, support for multiple prioritized encrypted and unencrypted storage options, and improved access control for authentication assets. Documentation has been updated to reflect these changes.
Thank you to everyone who participated and made this round of grants a great success and thank you to all our sustaining members and donors who make this initiative possible!
- QEP#269 Update older annotation items to new framework — report
-
sur gvSIG Team: Participación en el Workshop sobre Compartición y Reutilización de Open Source en el Sector Público LocalWorkshop
Publié: 7 February 2025, 3:15pm CET
Hoy me estreno en el blog de gvSIG para contaros nuestra participación en el Workshop on Open Source Sharing and Reuse in Local Public Sector Organisations, un evento clave para el debate sobre la reutilización de software libre en organizaciones del sector público local y regional.
Este taller ha sido una gran oportunidad para compartir experiencias y reflexionar sobre cómo se está adoptando y gestionando el software libre en diferentes instituciones. En particular, el debate se ha centrado en la validación de las conclusiones de la investigación llevada a cabo por OSOR (Open Source Observatory) sobre el uso del software libre en el sector público, tomando como referencia cinco proyectos analizados como casos de estudio.
La sesión ha sido altamente interactiva y ha permitido a los participantes aportar sus opiniones sobre temas clave como la gobernanza, la organización, la financiación y la sostenibilidad del software libre en el sector público. La agenda del workshop ha estado estructurada de la siguiente manera:
 Introducción y presentación de participantes Presentación de casos de estudio Exposición de hallazgos sobre gobernanza y organización Debate y feedback sobre gobernanza y organización Exposición de hallazgos sobre financiación y sostenibilidad Debate y feedback sobre financiación y sostenibilidad Conclusiones y cierre
La reutilización del software libre en el sector público es un tema estratégico que puede generar grandes beneficios en términos de eficiencia, reducción de costes y soberanía tecnológica. Sin embargo, también presenta desafíos que requieren una reflexión profunda sobre la manera en que se organizan los proyectos, se gestionan los recursos y se garantiza su sostenibilidad a largo plazo.
Desde gvSIG seguimos comprometidos con estos debates y con la promoción de modelos abiertos y colaborativos en el ámbito de los Sistemas de Información Geográfica y la Infraestructura de Datos Espaciales.
¿Te interesa este tema? ¡Déjanos tus comentarios y sigamos la conversación!
-
sur Mappery: Brooklyn: A Nostalglarama
Publié: 7 February 2025, 12:00pm CET

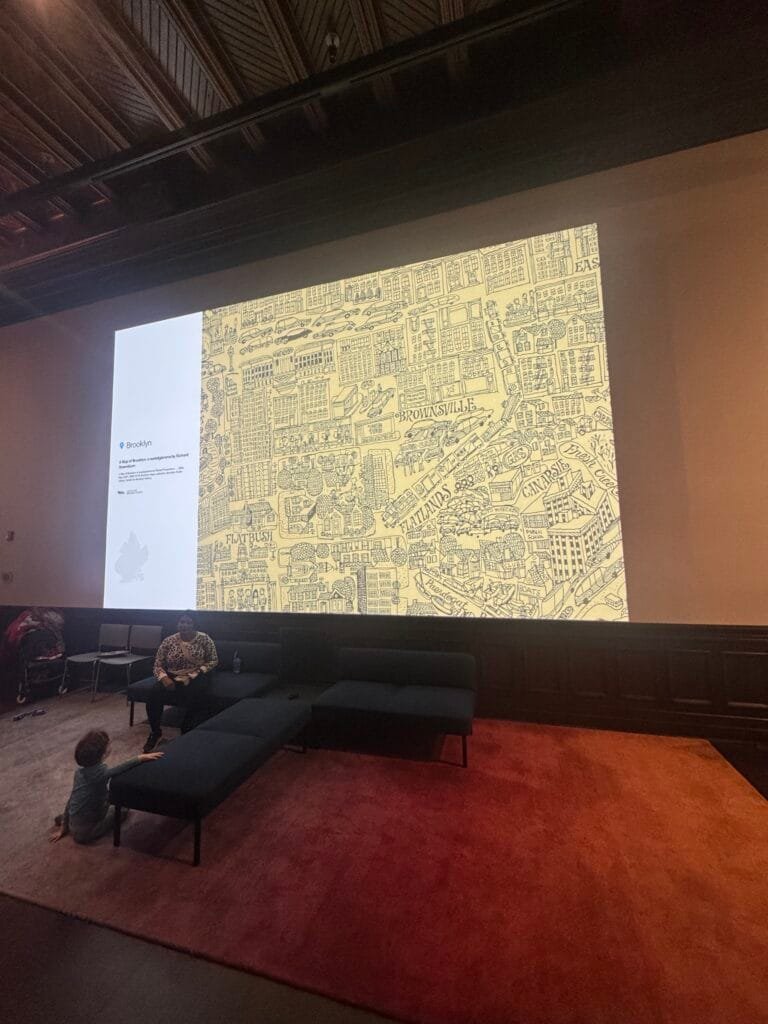
At the Brooklyn Library they had an area where there was a rotating display of artwork from and about the city, I particularly liked this map of the Brooklyn neighbourhoods.
“A Map of Brooklyn: a nostalglarama by Richard Rosenblum”
-
sur Camptocamp: GeoNetwork-ui code sprint in Berlin
Publié: 7 February 2025, 2:00am CET
Pièce jointe: [télécharger]
At the end of January, we organized the first GeoNetwork-ui code sprint in our Berlin offices. We were about 15 people from different countries, companies and backgrounds - developers for most, but also architects, product owners & project managers. -
sur Mappery: Brooklyn Coasters
Publié: 6 February 2025, 12:00pm CET

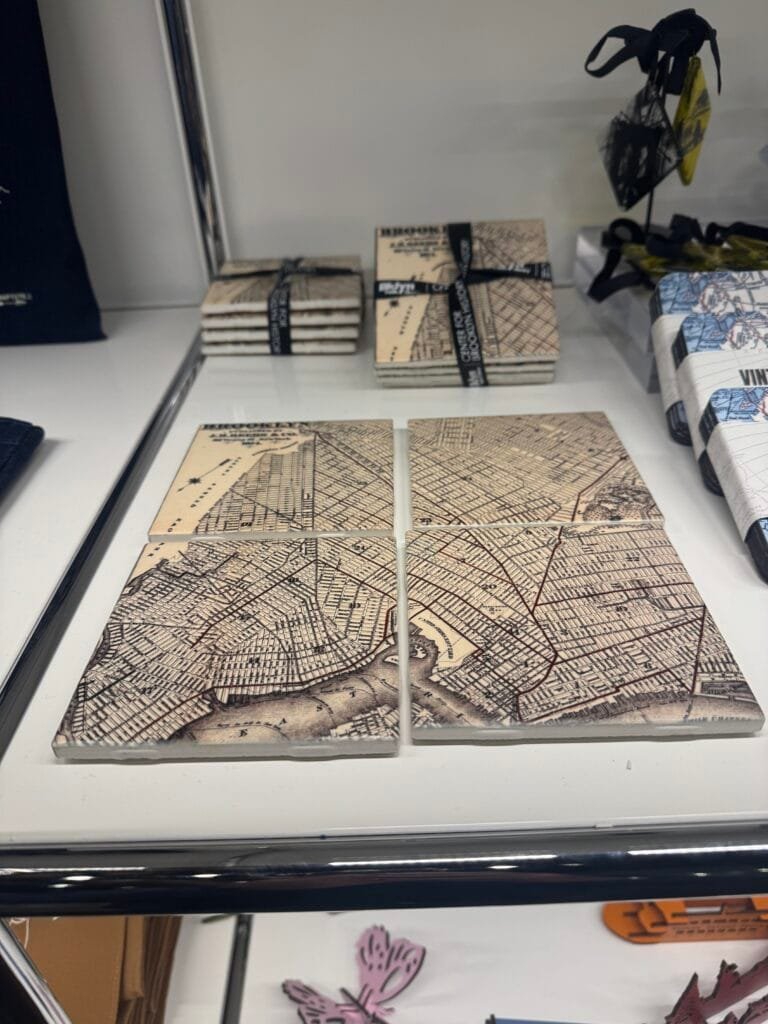
I spotted these ceramic coasters at the Brooklyn Library, now I’m home I wish I had bought them.
-
sur GeoTools Team: GeoTools 28.6 Released
Publié: 5 February 2025, 11:06pm CET
The GeoTools shares the release of GeoTools 28.6 available for Java 8 applications: geotools-2.28.6-bin.zip geotools-2.28.6-doc.zip geotools-2.28.6-userguide.zip geotools-2.28.6-project.zipThis release is also available from the OSGeo Maven Repository and is made to support the upcoming GeoNetwork 4.2.12 release.This release provides -
sur gvSIG Batoví: Ponte las gafas de la Geografía
Publié: 5 February 2025, 5:44pm CET

Un lindo mini-video para promover la carrera de Geografía (de la Universidad de Zaragoza)
-
sur Mappery: Avenue for Change
Publié: 5 February 2025, 12:00pm CET
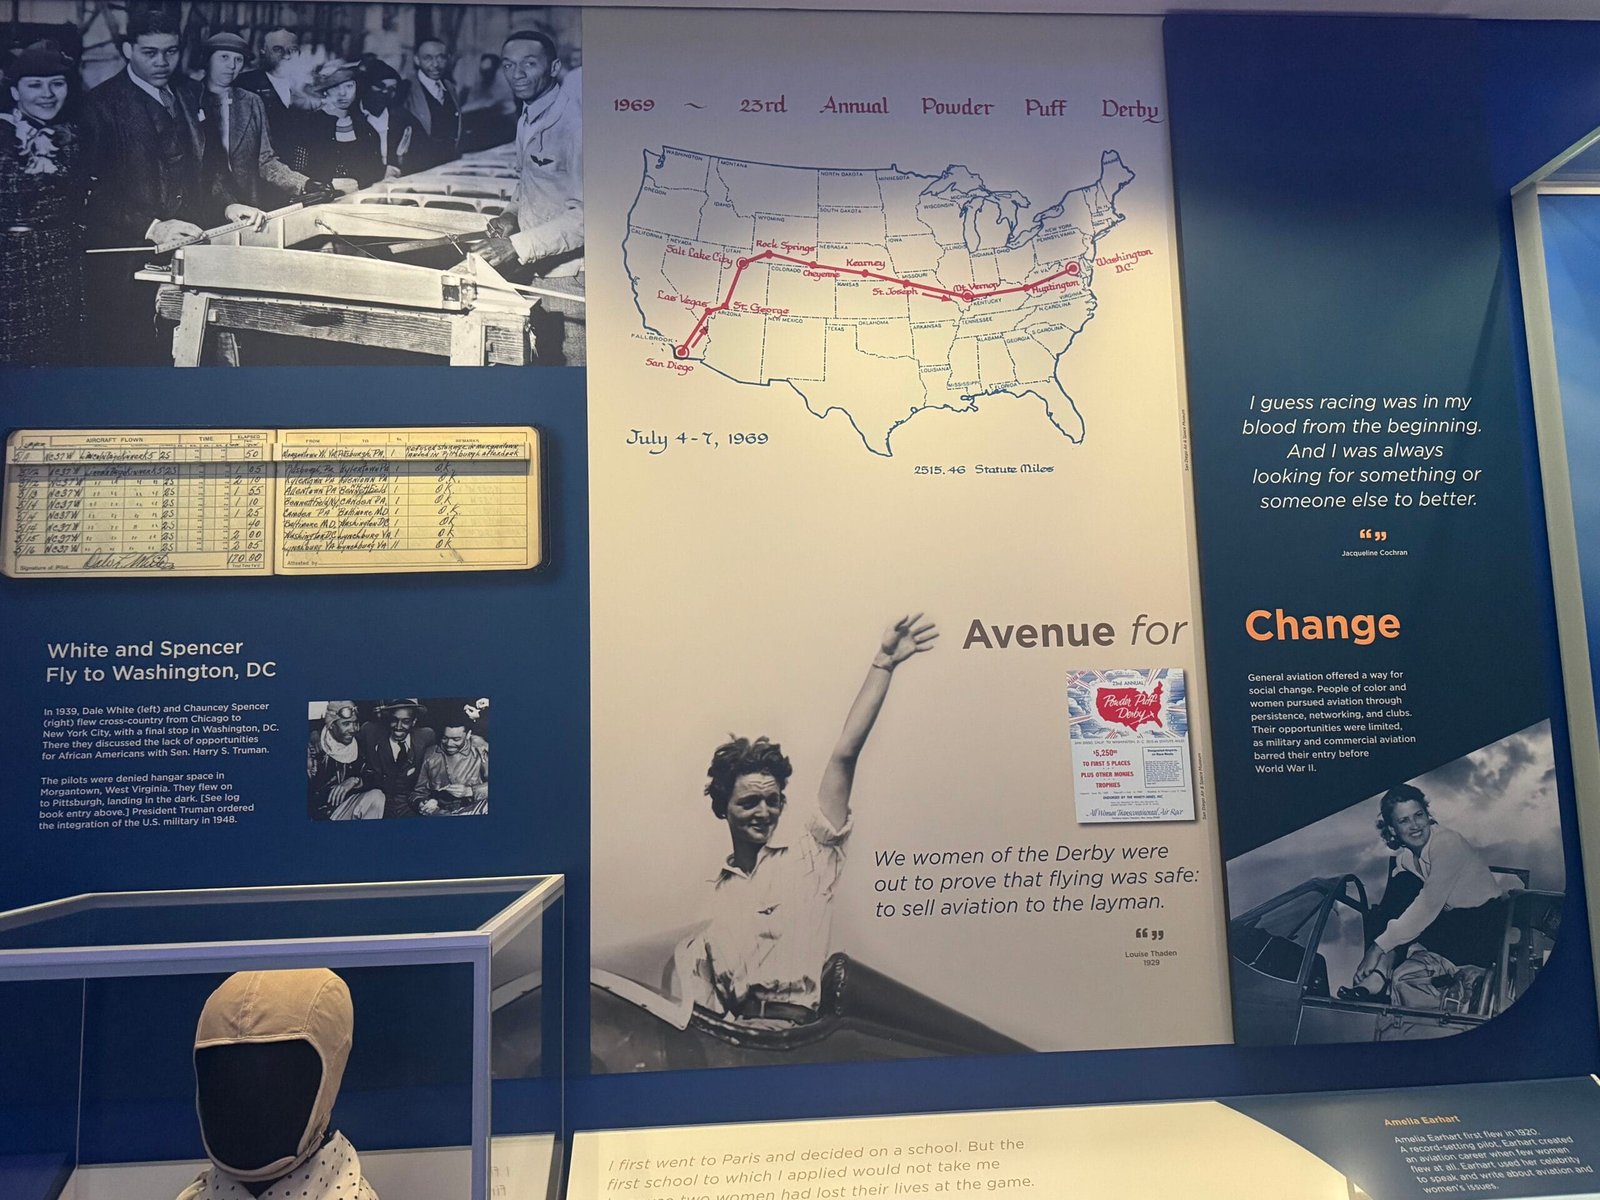
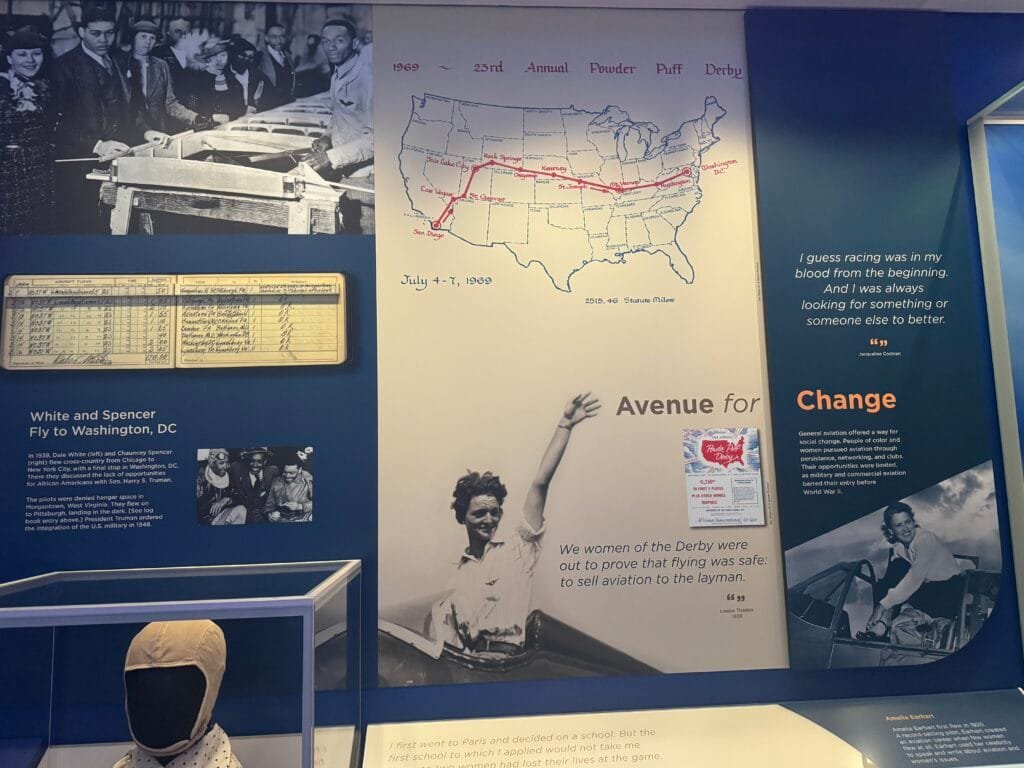
The Women’s Air Derby was the first official women-only air race in the United States. Humorist Will Rogers referred to it as the Powder Puff Derby, the name by which the race is most commonly known.
-
sur Mappery: A World of Neighbours
Publié: 4 February 2025, 12:00pm CET


Another Pan Am poster, those guys had style.
-
sur Paul Ramsey: WKB EMPTY
Publié: 3 February 2025, 6:00pm CET
I have been watching the codification of spatial data types into GeoParquet and now GeoIceberg with some interest, since the work is near and dear to my heart.
Writing a disk serialization for PostGIS is basically an act of format standardization – albeit a standard with only one consumer – and many of the same issues that the Parquet and Iceberg implementations are thinking about are ones I dealt with too.
Here is an easy one: if you are going to use well-known binary for your serialiation (as GeoPackage, and GeoParquet do) you have to wrestle with the fact that the ISO/OGC standard for WKB does not describe a standard way to represent empty geometries.

Empty geometries come up frequently in the OGC/ISO standards, and they are simple to generate in real operations – just subtract a big thing from a small thing.
SELECT ST_AsText(ST_Difference(
	'POLYGON((0 0, 1 0, 1 1, 0 1, 0 0))',
	'POLYGON((-1 -1, 3 -1, 3 3, -1 3, -1 -1))'
	))
If you have a data set and are running operations on it, eventually you will generate some empties.
Which means your software needs to know how to store and transmit them.
Which means you need to know how to encode them in WKB.
And the standard is no help.
But I am!
WKB CommonalitiesAll WKB geometries start with 1-byte “byte order flag” followed by a 4-byte “geometry type”.
enum wkbByteOrder  {
    wkbXDR = 0, // Big Endian
    wkbNDR = 1  // Little Endian
};
The byte order flag signals which “byte order” all the other numbers will be encoded with. Most modern hardware uses “least significant byte first” (aka “little endian”) ordering, so usually the value will be “1”, but readers must expect to occasionally get “big endian” encoded data.
enum wkbGeometryType {
    wkbPoint = 1,
    wkbLineString = 2,
    wkbPolygon = 3,
    wkbMultiPoint = 4,
    wkbMultiLineString = 5,
    wkbMultiPolygon = 6,
    wkbGeometryCollection = 7
};
The type number is an integer from 1 to 7, in the indicated byte order.
CollectionsCollections are easy! GeometryCollection, MultiPolygon, MultiLineString and MultiPoint all have a WKB structure like this:
wkbCollection {
    byte    byteOrder;
    uint32  wkbType;
    uint32  numWkbSubGeometries;
    WKBGeometry wkbSubGeometries[numWkbSubGeometries];
}
The way to signal an empty collection is to set its numGeometries value to zero.
So for example, a
MULTIPOLYGON EMPTYwould look like this (all examples in little endian, spaces added between elements for legibility, using hex encoding).01 06000000 00000000The elements are:
- The byte order flag
- The geometry type (6 == MultiPolygon)
- The number of sub-geometries (zero)
The Polygon and LineString types are also very easy, because after their type number they both have a count of sub-objects (rings in the case of Polygon, points in the case of LineString) which can be set to zero to indicate an empty geometry.
For a LineString:
01 02000000 00000000For a Polygon:
01 03000000 00000000It is possible to create a Polygon made up of a non-zero number of empty linear rings. Is this construction empty? Probably. Should you make one of them? Probably not, since
PointsPOLYGON EMPTYdescribes the case much more simply.Saving the best for last!
One of the strange blind spots of the ISO/OGC standards is the WKB Point. There is an standard text representation for an empty point,
POINT EMPTY. But there nowhere in the standard a description of a WKB empty point, and the WKB structure of a point doesn’t really leave any place to hide one.WKBPoint { byte byteOrder; uint32 wkbType; // 1 double x; double y; };After the standard byte order flag and type number, the serialization goes directly into the coordinates. There’s no place to put in a zero.
In PostGIS we established our own add-on to the WKB standard, so we could successfully round-trip a
POINT EMPTYthrough WKB – empty points are to be represented as a point with all coordinates set to the IEEE NaN value.Here is a little-endian empty point.
01 01000000 000000000000F87F 000000000000F87FAnd a big-endian one.
00 00000001 7FF8000000000000 7FF8000000000000Most open source implementations of WKB have converged on this standardization of
POINT EMPTY. The most common alternate behaviour is to convertPOINT EMPTYobject, which are not representable, intoMULTIPOINT EMPTYobjects, which are. This might be confusing (an empty point would round-trip back to something with a completely different type number).In general, empty geometries create a lot of “angels dancing on the head of a pin” cases for functions that otherwise have very deterministic results.
- “What is the distance in meters between a point and an empty polygon?” Zero? Infinity? NULL? NaN?
- “What geometry type is the interesection of an empty polygon and empty line?” Do I care? I do if I am writing a database system and have to provide an answer.
Over time the PostGIS project collated our intuitions and implementations in this wiki page of empty geometry handling rules.
The trouble with empty handling is that there are simultaneously a million different combinations of possibilities, and extremely low numbers of people actually exercising that code line. So it’s a massive time suck. We have basically been handling them on an “as needed” basis, as people open tickets on them.
Other Databases- SQL Server changes
POINT EMPTYtoMULTIPOINT EMPTYwhen generating WKB.SELECT Geometry::STGeomFromText('POINT EMPTY',4326).STAsBinary() 0x010400000000000000 - MariaDB and SnowFlake return NULL for a
POINT EMPTYWKB.SELECT ST_AsBinary(ST_GeomFromText('POINT EMPTY')) NULL
-
sur Mappery: Pan American World Airways
Publié: 3 February 2025, 12:00pm CET
Pièce jointe: [télécharger]

There is something exquisite and nostalgic about this old Pan Am logo
-
sur Mappery: Weekend Round the World
Publié: 2 February 2025, 12:00pm CET
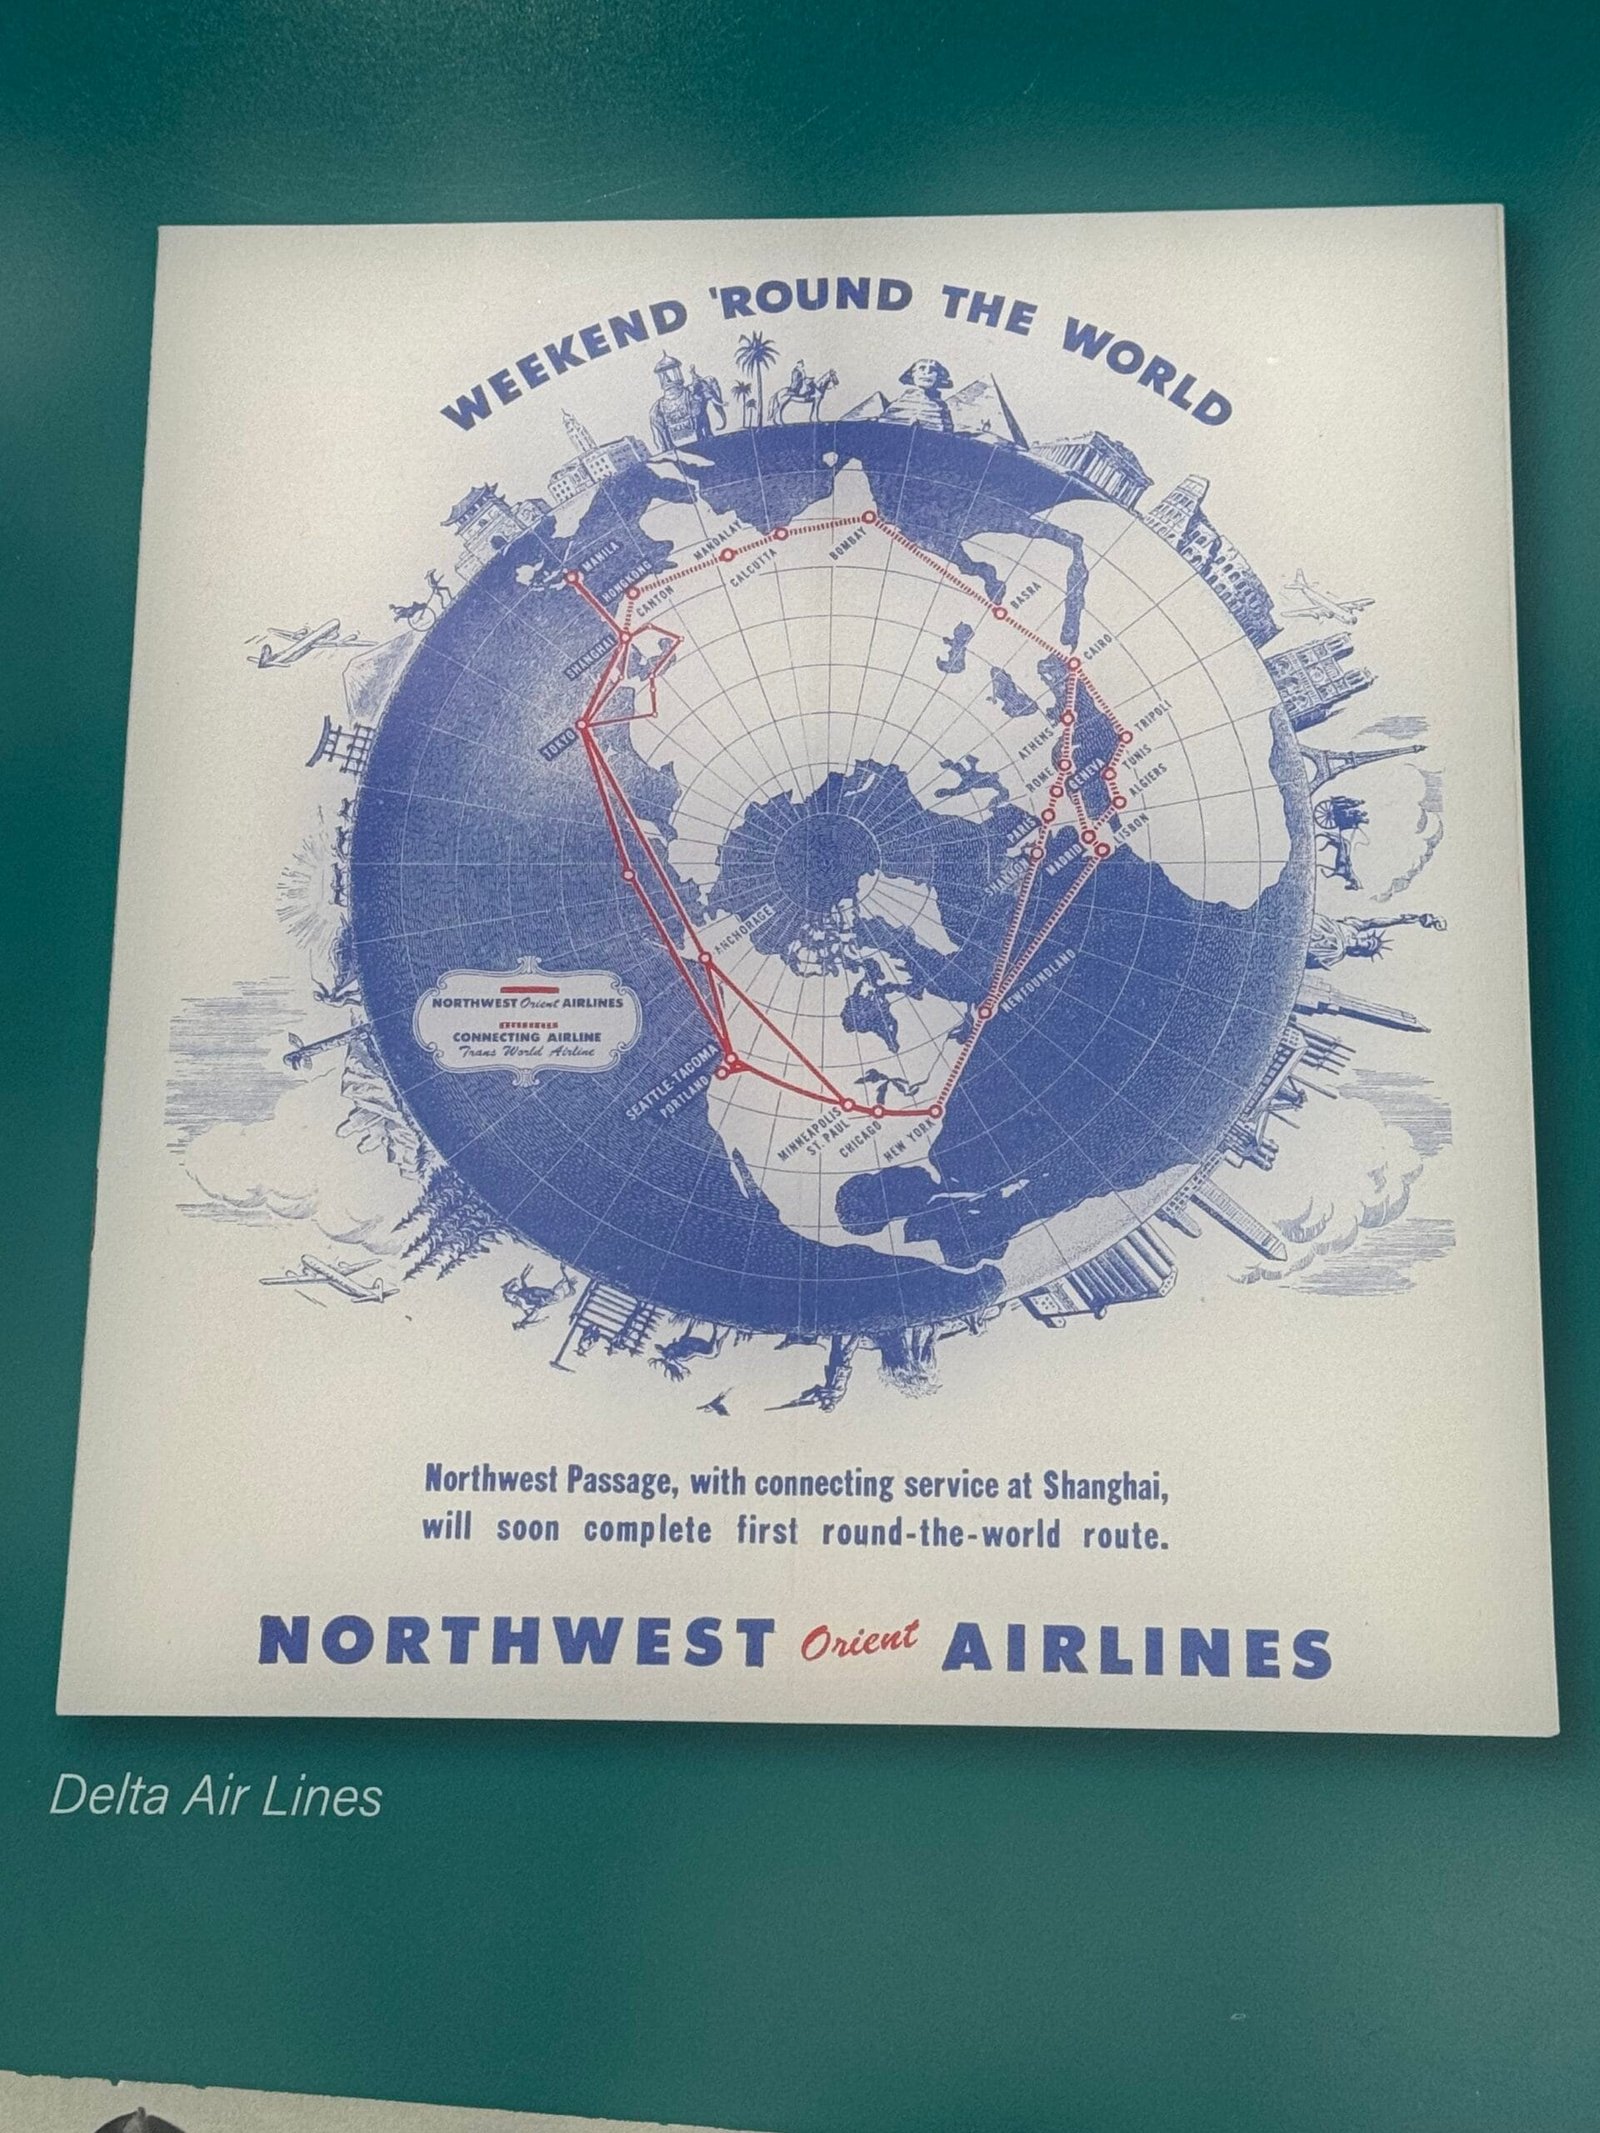

There are a few coming up from the National Air and Space Museum in Washington, this place was heaven for map loving air and space nerds like me. This poster dates from the late 1940’s, pretty is an understatement.
-
sur Mappery: Native Foods Feed the World
Publié: 1 February 2025, 12:00pm CET
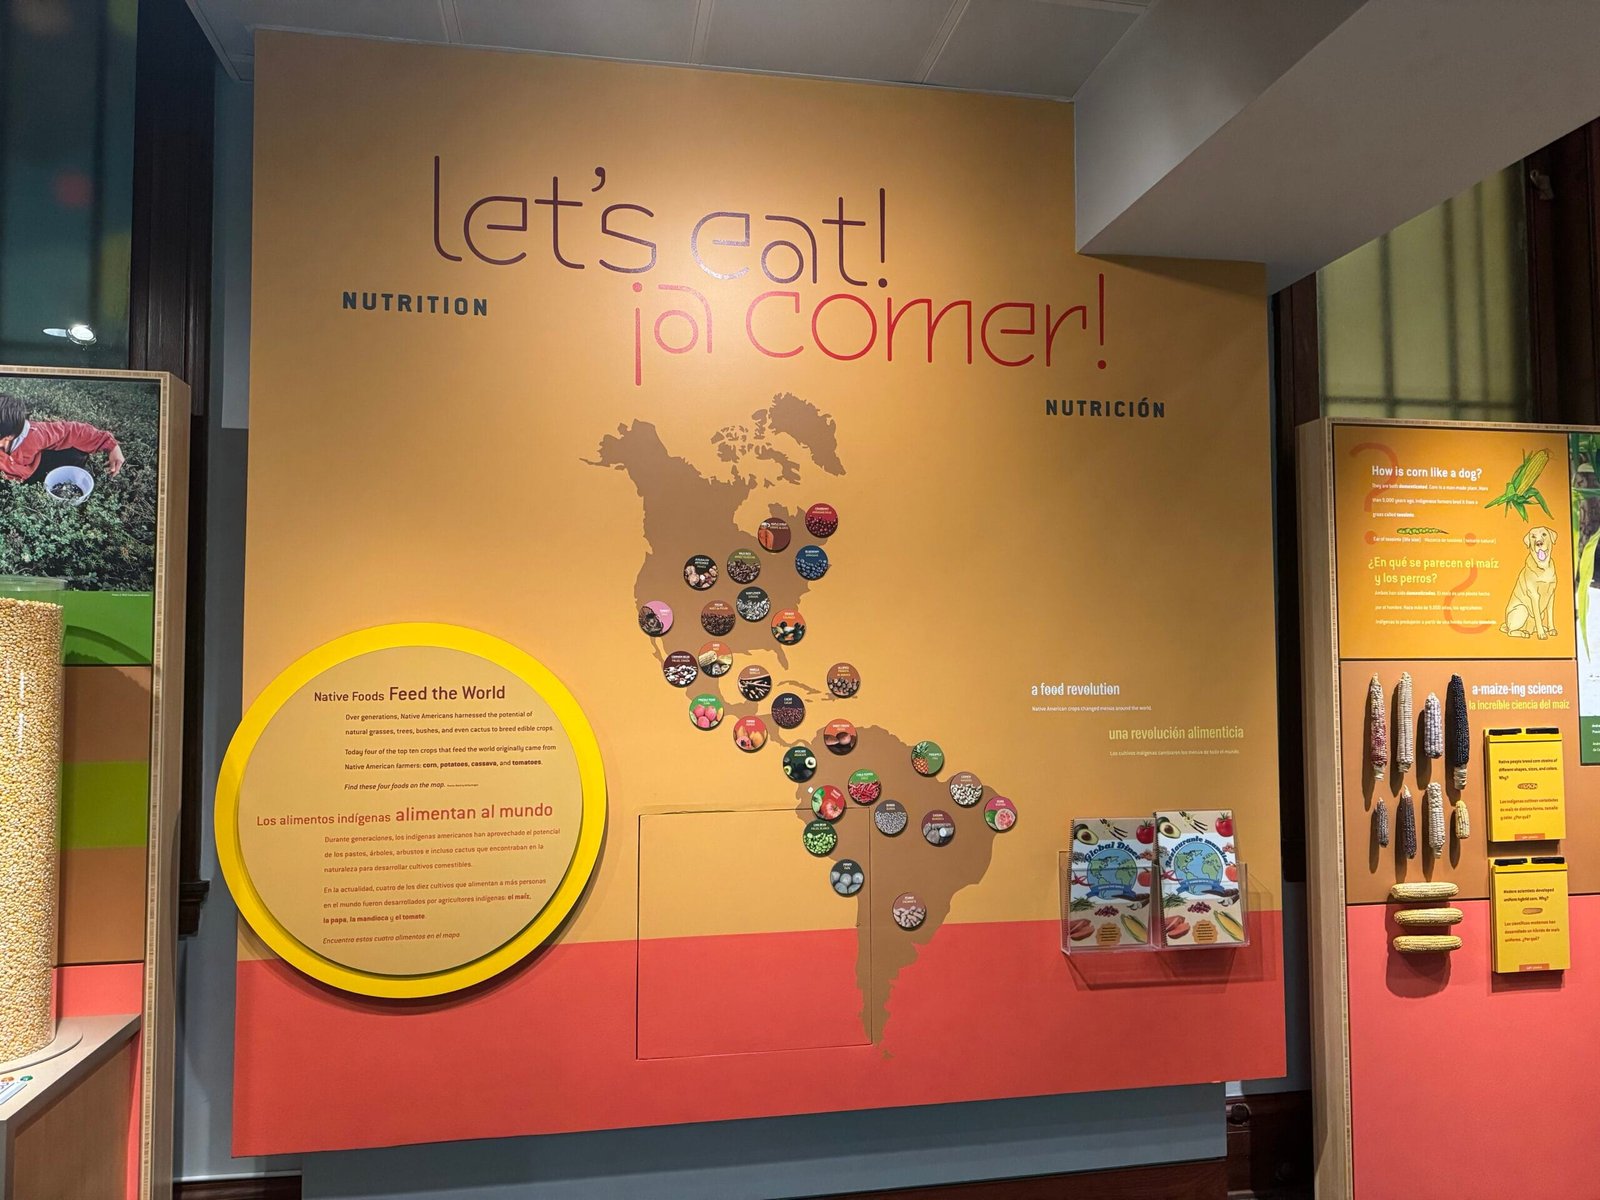

This was also in the display at the National Museum of the American Indian in NYC.
“Over generations, Native Americans harnessed the potential of natural grasses, trees, bushes, and even cactus to breed edible crops. Today four of the top ten crops that feed the world originally came from Native American farmers: corn, potatoes, cassava, and tomatoes.” -
sur Free and Open Source GIS Ramblings: Geocomputation with Python: Now in Print!
Publié: 31 January 2025, 7:56pm CET
Today, I’m super excited to share with you the announcement that our open source textbook “Geocomputation with Python” has finally arrived in print and is now available for purchase from Routledge.com, Amazon.com, Amazon.co.uk, and other booksellers.

“Geocomputation with Python” (or geocompy for short) covers the entire range of standard GIS operations for both vector and raster data models. Each section and chapter builds on the previous. If you’re just starting out with Python to work with geographic data, we hope that the book will be an excellent place to start.
Of course, you can still find the online version of the book at py.geocompx.org.
The book is open-source and you can find the code on GitHub. This ensures that the content is reproducible, transparent, and accessible. It also lets you interact with the project by opening issues and submitting pull requests.
-
sur Mappery: Native Innovation
Publié: 31 January 2025, 12:00pm CET

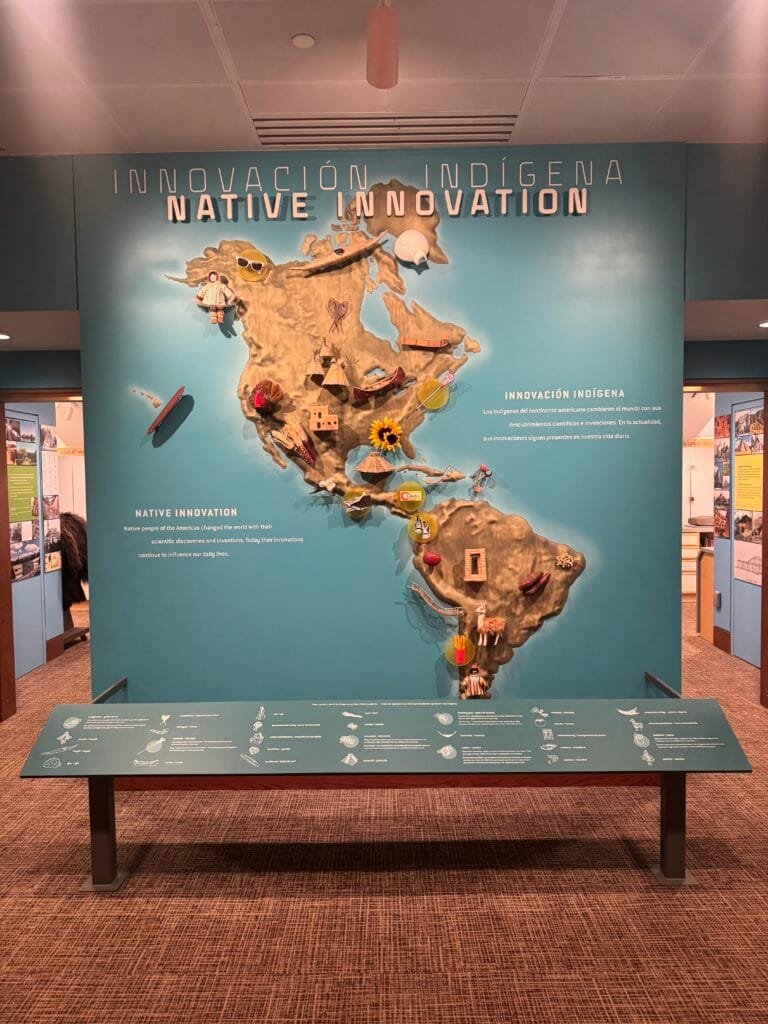
Saw this at the National Museum of the American Indian in New York, it illustrates some of the inventions that we take for granted nowadays which originated in America before colonisation.
“Native people of the Americas changed the world with their scientific discoveries and inventions. Today their innovations continue to influence our daily lives.”
-
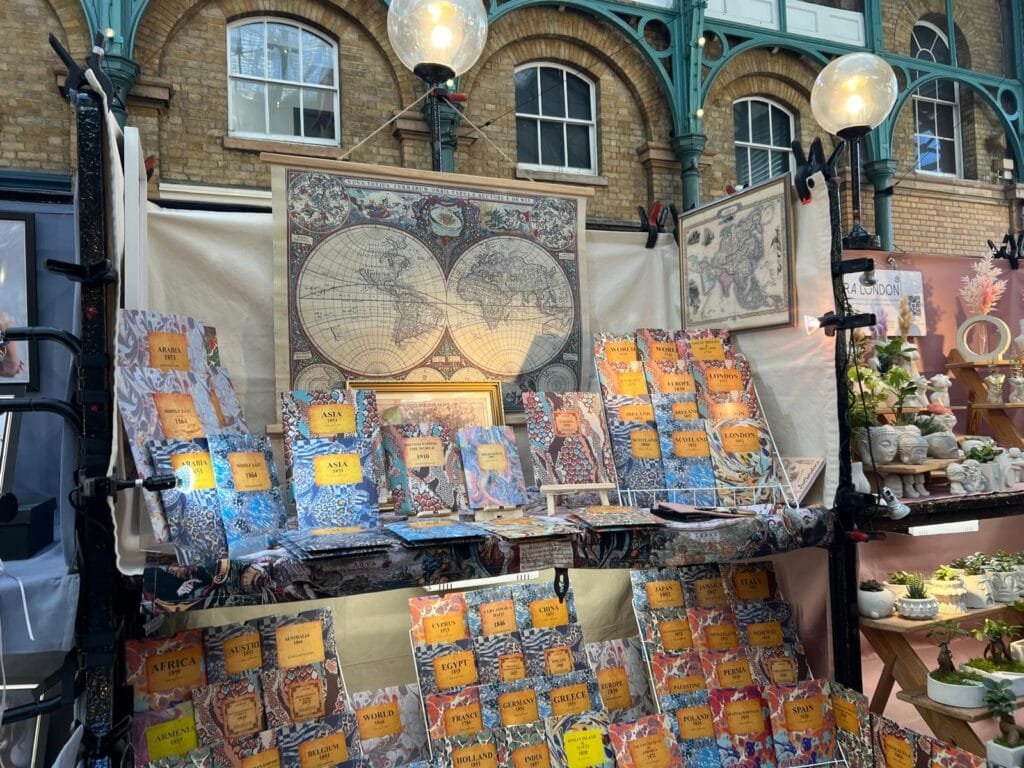
sur Mappery: Maps on the Street
Publié: 30 January 2025, 12:00pm CET

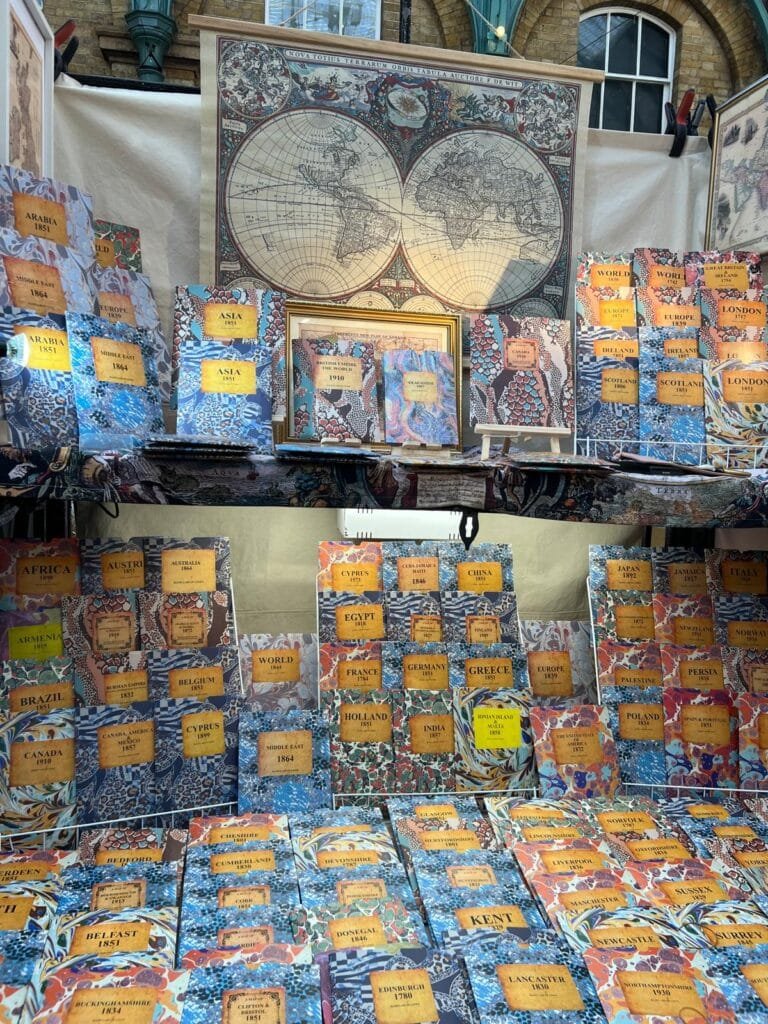
Elizabeth spotted this collection of maps for sale in Covent Garden recently, lots of interesting old maps.
-
sur Mappery: Support Your Local Growers
Publié: 29 January 2025, 12:00pm CET
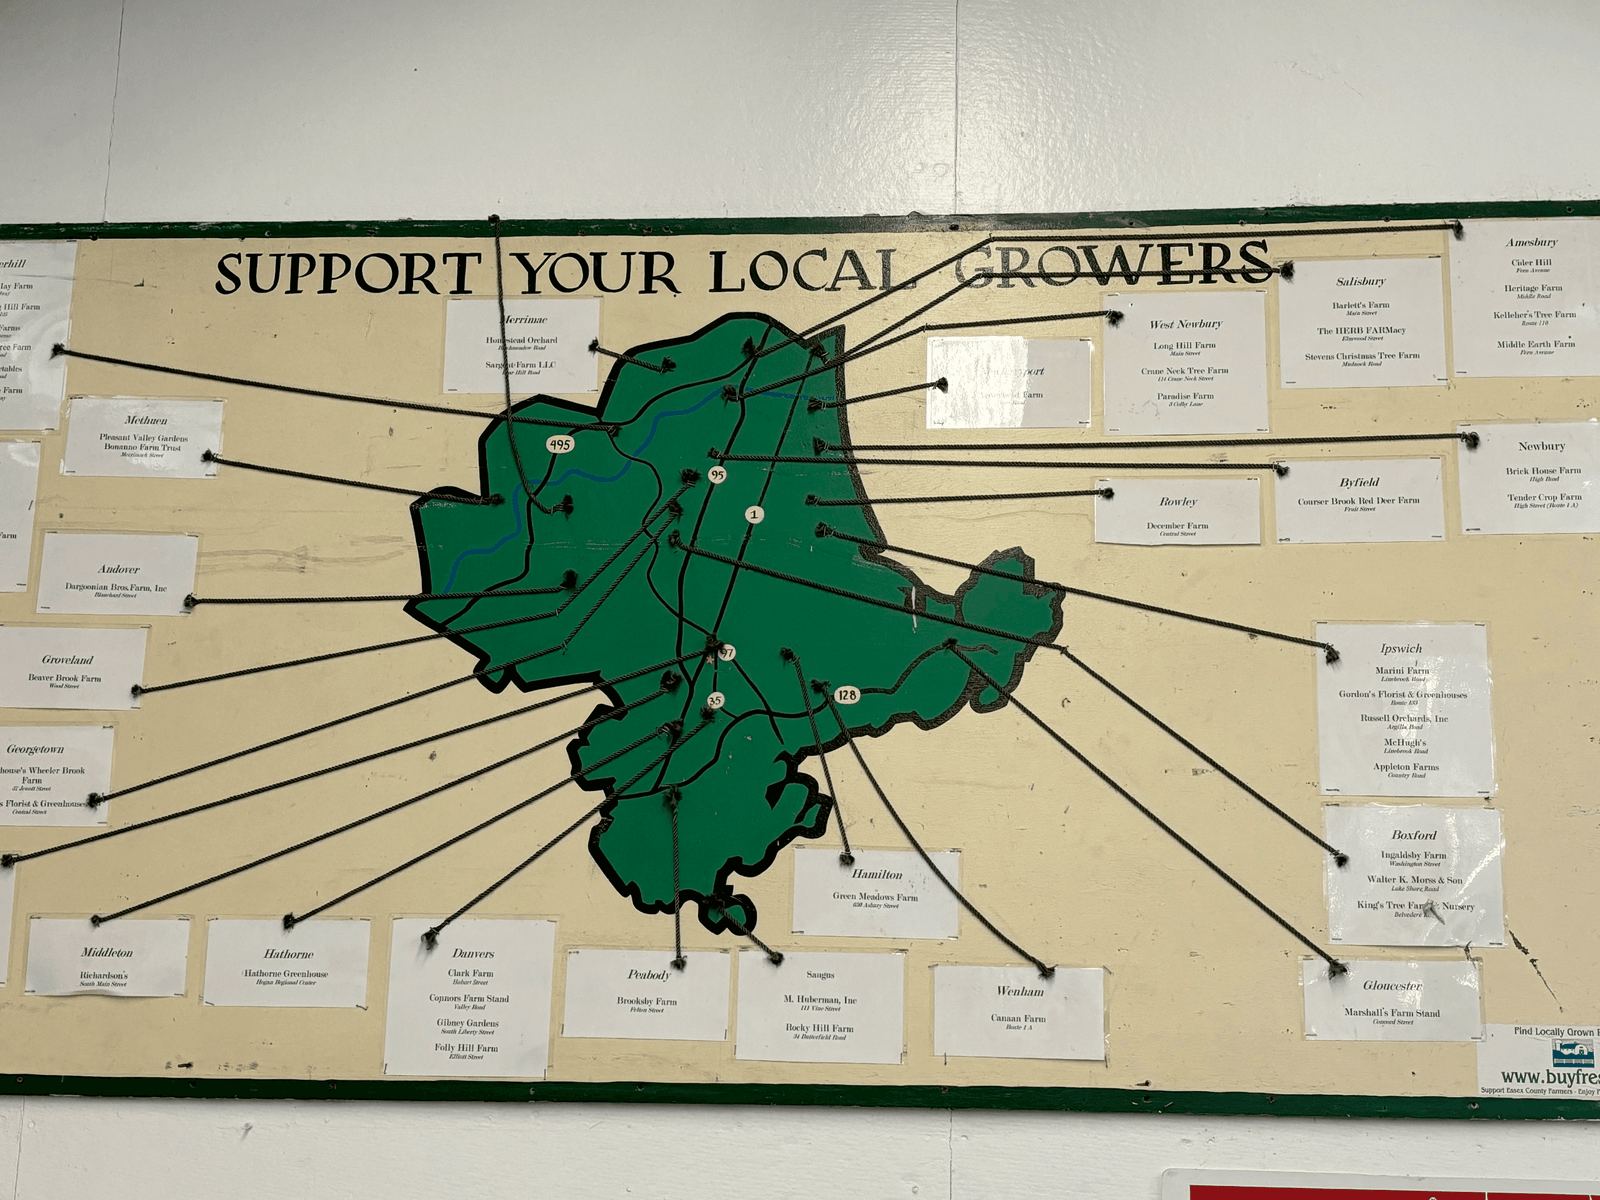
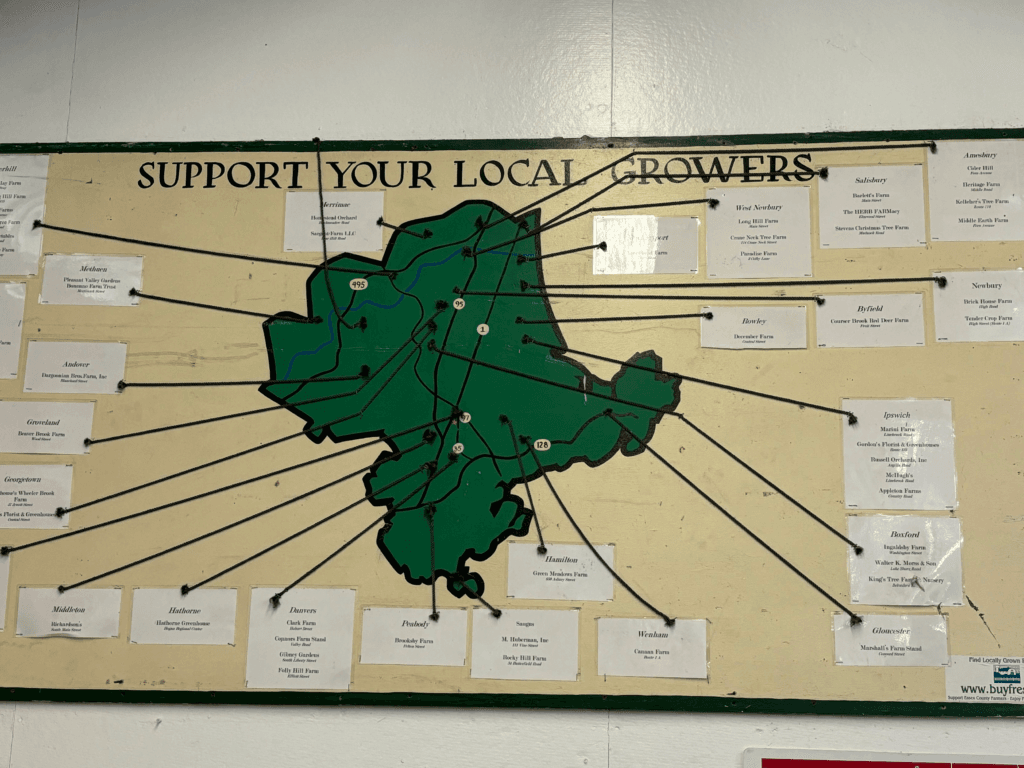
Doug Greenfield shared this “Support your local growers #MapsintheWild Topsfield Fair, northeastern Massachusetts”
-
sur Mappery: Metro Lyon
Publié: 28 January 2025, 12:00pm CET

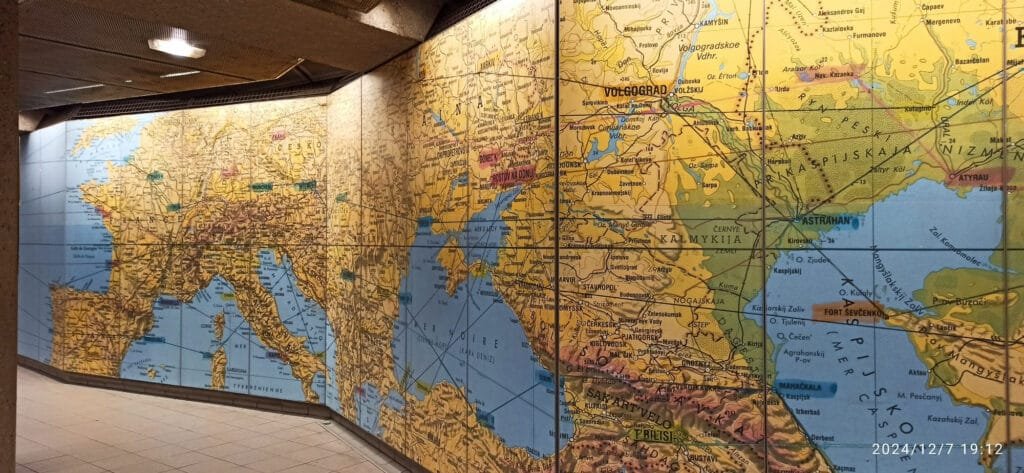
Joe Davies shared another picture from Lyon. The city where I grew up! The photo comes from the underground metro station at Place Jean Jaures, Lyon 7eme.
-
sur GeoTools Team: GeoTools 32.2 Released
Publié: 27 January 2025, 9:49pm CET
GeoTools 32.2 released The GeoTools team is pleased to announce the release of the latest stable version of GeoTools 32.2: geotools-32.2-bin.zip geotools-32.2-doc.zip geotools-32.2-userguide.zip geotools-32.2-project.zip This release is also available from the OSGeo Maven Repositoryand is made in conjunction with GeoServer 2.26.2 and GeoWebCache 1.26.2. We are grateful to Jody Garnett (GeoCat) -
sur Mappery: Lyon after the rain
Publié: 27 January 2025, 12:00pm CET

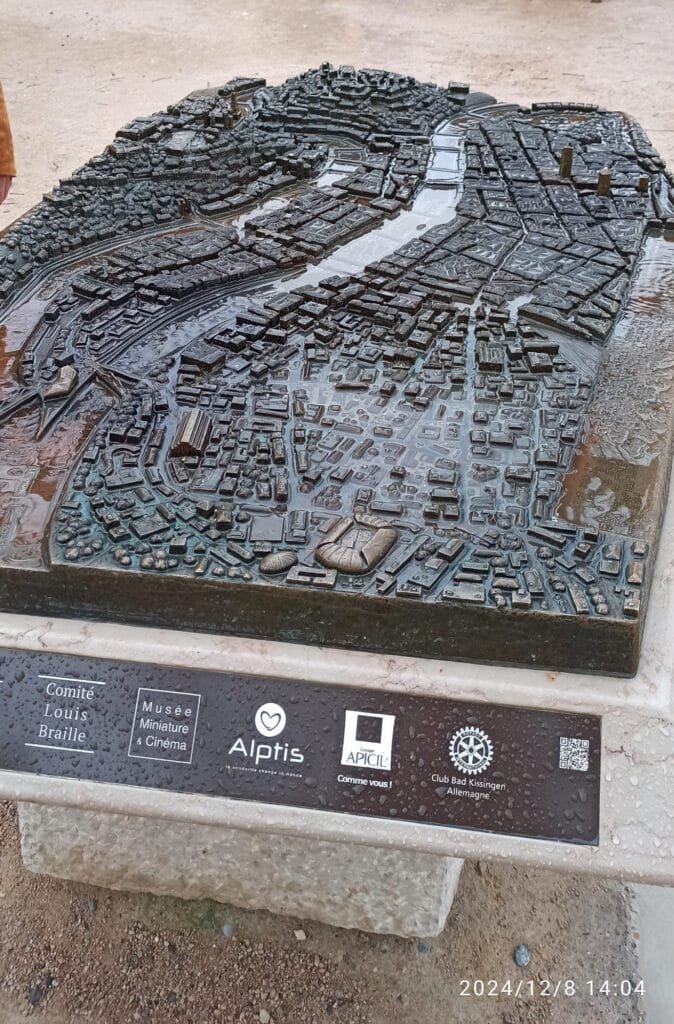
Joe Davies shared this picture, saying: The rain made this 3D model of Lyon even better!
I am happy to see the neighbourhood I used to live in is not flooded.
-
sur GRASS GIS: GRASS Annual Report 2024
Publié: 27 January 2025, 10:12am CET
There has been a lot of activity in 2024, so let’s recap the achievements and highlight the awesome community behind GRASS GIS! Community Meeting The annual GRASS GIS Community Meeting was held once again in the Czech Republic, this time at the NC State European Center in Prague. The meeting brought together users, supporters, contributors, power users and developers to collaborate and chart the future of the project. Thanks to the support from the U. -
sur GeoServer Team: GeoServer 2.26.2 Release
Publié: 27 January 2025, 2:00am CET
GeoServer 2.26.2 release is now available with downloads (bin, war, windows), along with docs and extensions.
This is a stable release of GeoServer recommended for production use. GeoServer 2.26.2 is made in conjunction with GeoTools 32.2, GeoWebCache 1.26.2, and ImageIO-Ext 1.4.14.
Thanks to Jody Garnett for making this release.
Security ConsiderationsThis release addresses security vulnerabilities and is recommended.
- CVE-2024-38524 Moderate
See project security policy for more information on how security vulnerabilities are managed.
File System Sandbox IsolationA file system sandbox is used to limit access for GeoServer Administrators and Workspace Administrators to specified file folders.
-
A system sandbox is established using
GEOSERVER_FILESYSTEM_SANDBOXapplication property, and applies to the entire application, limiting GeoServer administrators to the<sandbox>folder, and individual workspace administrators into isolated<sandbox>/<workspace>folders. -
A regular sandbox can be configured from the Security > Data screen, and is used to limit individual workspace administrators into
<sandbox>/<workspace>folders to avoid accessing each others files.
Thanks to Andrea (GeoSolutions) for this important improvement at the bequest of Munich RE.
Developer Updates Palantir formatterA nice update for GeoServer developers is an updated formatter that is both wider at 120 columns, and plays well with the use of lamda expressions.
List<TemplateBuilder> filtered = children.stream()
        .filter(b -> b instanceof DynamicValueBuilder || b instanceof SourceBuilder)
        .collect(Collectors.toList());
Thanks to Andrea for this improvement, and coordinating the change across all active branches.
Release notesNew Features:
- GEOS-11616 GSIP 229 - File system access isolation
- GEOS-11644 Introducing the rest/security/acl/catalog/reload rest endpoint
Improvement:
- GEOS-11612 Add system property support for Proxy base URL -> use headers activation
- GEOS-11615 Update to Imageio-EXT 1.4.14
- GEOS-11683 MapML WMS Features Coordinate Precision Should be adjusted based on scale
Bug:
- GEOS-11636 Store panels won’t always show feedback in target panels
- GEOS-11494 WFS GetFeature request with a propertyname parameter fails when layer attributes are customized (removed or reordered)
- GEOS-11606 geofence-server imports obsolete asm dep
- GEOS-11611 When Extracting the WFS Service Name from the HTTP Request A Slash Before the Question Marks Causes Issues
- GEOS-11630 REST API throws HTTP 500 When Security Metadata Has Null Attributes
- GEOS-11643 WCS input read limits can be fooled by geotiff reader
- GEOS-11647 Restore “quiet on not found” configuration for REST in global settings
- GEOS-11649 welcome page per-layer is not respecting global service enablement
- GEOS-11672 GWC virtual services available with empty contents
- GEOS-11681 MapML raster GetFeatureInfo not working
Task:
- GEOS-11608 Update Bouncy Castle Crypto package from bcprov-jdk15on:1.69 to bcprov-jdk18on:1.79
- GEOS-11631 Update MySQL driver to 9.1.0
- GEOS-11650 Update dependencies for monitoring-kafka module
- GEOS-11659 Apply Palantir Java format on GeoServer
- GEOS-11671 Upgrade H3 dependency to 3.7.3
- GEOS-11685 Bump jetty.version from 9.4.56.v20240826 to 9.4.57.v20241219
For the complete list see 2.26.2 release notes.
Community UpdatesCommunity module development:
- GEOS-11635 Add support for opaque auth tokens in OpenID connect
- GEOS-11637 DGGS min/max resolution settings stop working after restart
- GEOS-11680 Azure COG assembly lacks mandatory libraries, won’t work
- GEOS-11686 Clickhouse DGGS stores cannot properly read dates
- GEOS-11687 OGC API packages contain gs-web-core
- GEOS-11691 Smart data loader accepts bigint and bigserial but not int8 postgresql type alias
Community modules are shared as source code to encourage collaboration. If a topic being explored is of interest to you, please contact the module developer to offer assistance.
About GeoServer 2.26 SeriesAdditional information on GeoServer 2.26 series:
-
sur Mappery: Leicester
Publié: 26 January 2025, 12:00pm CET
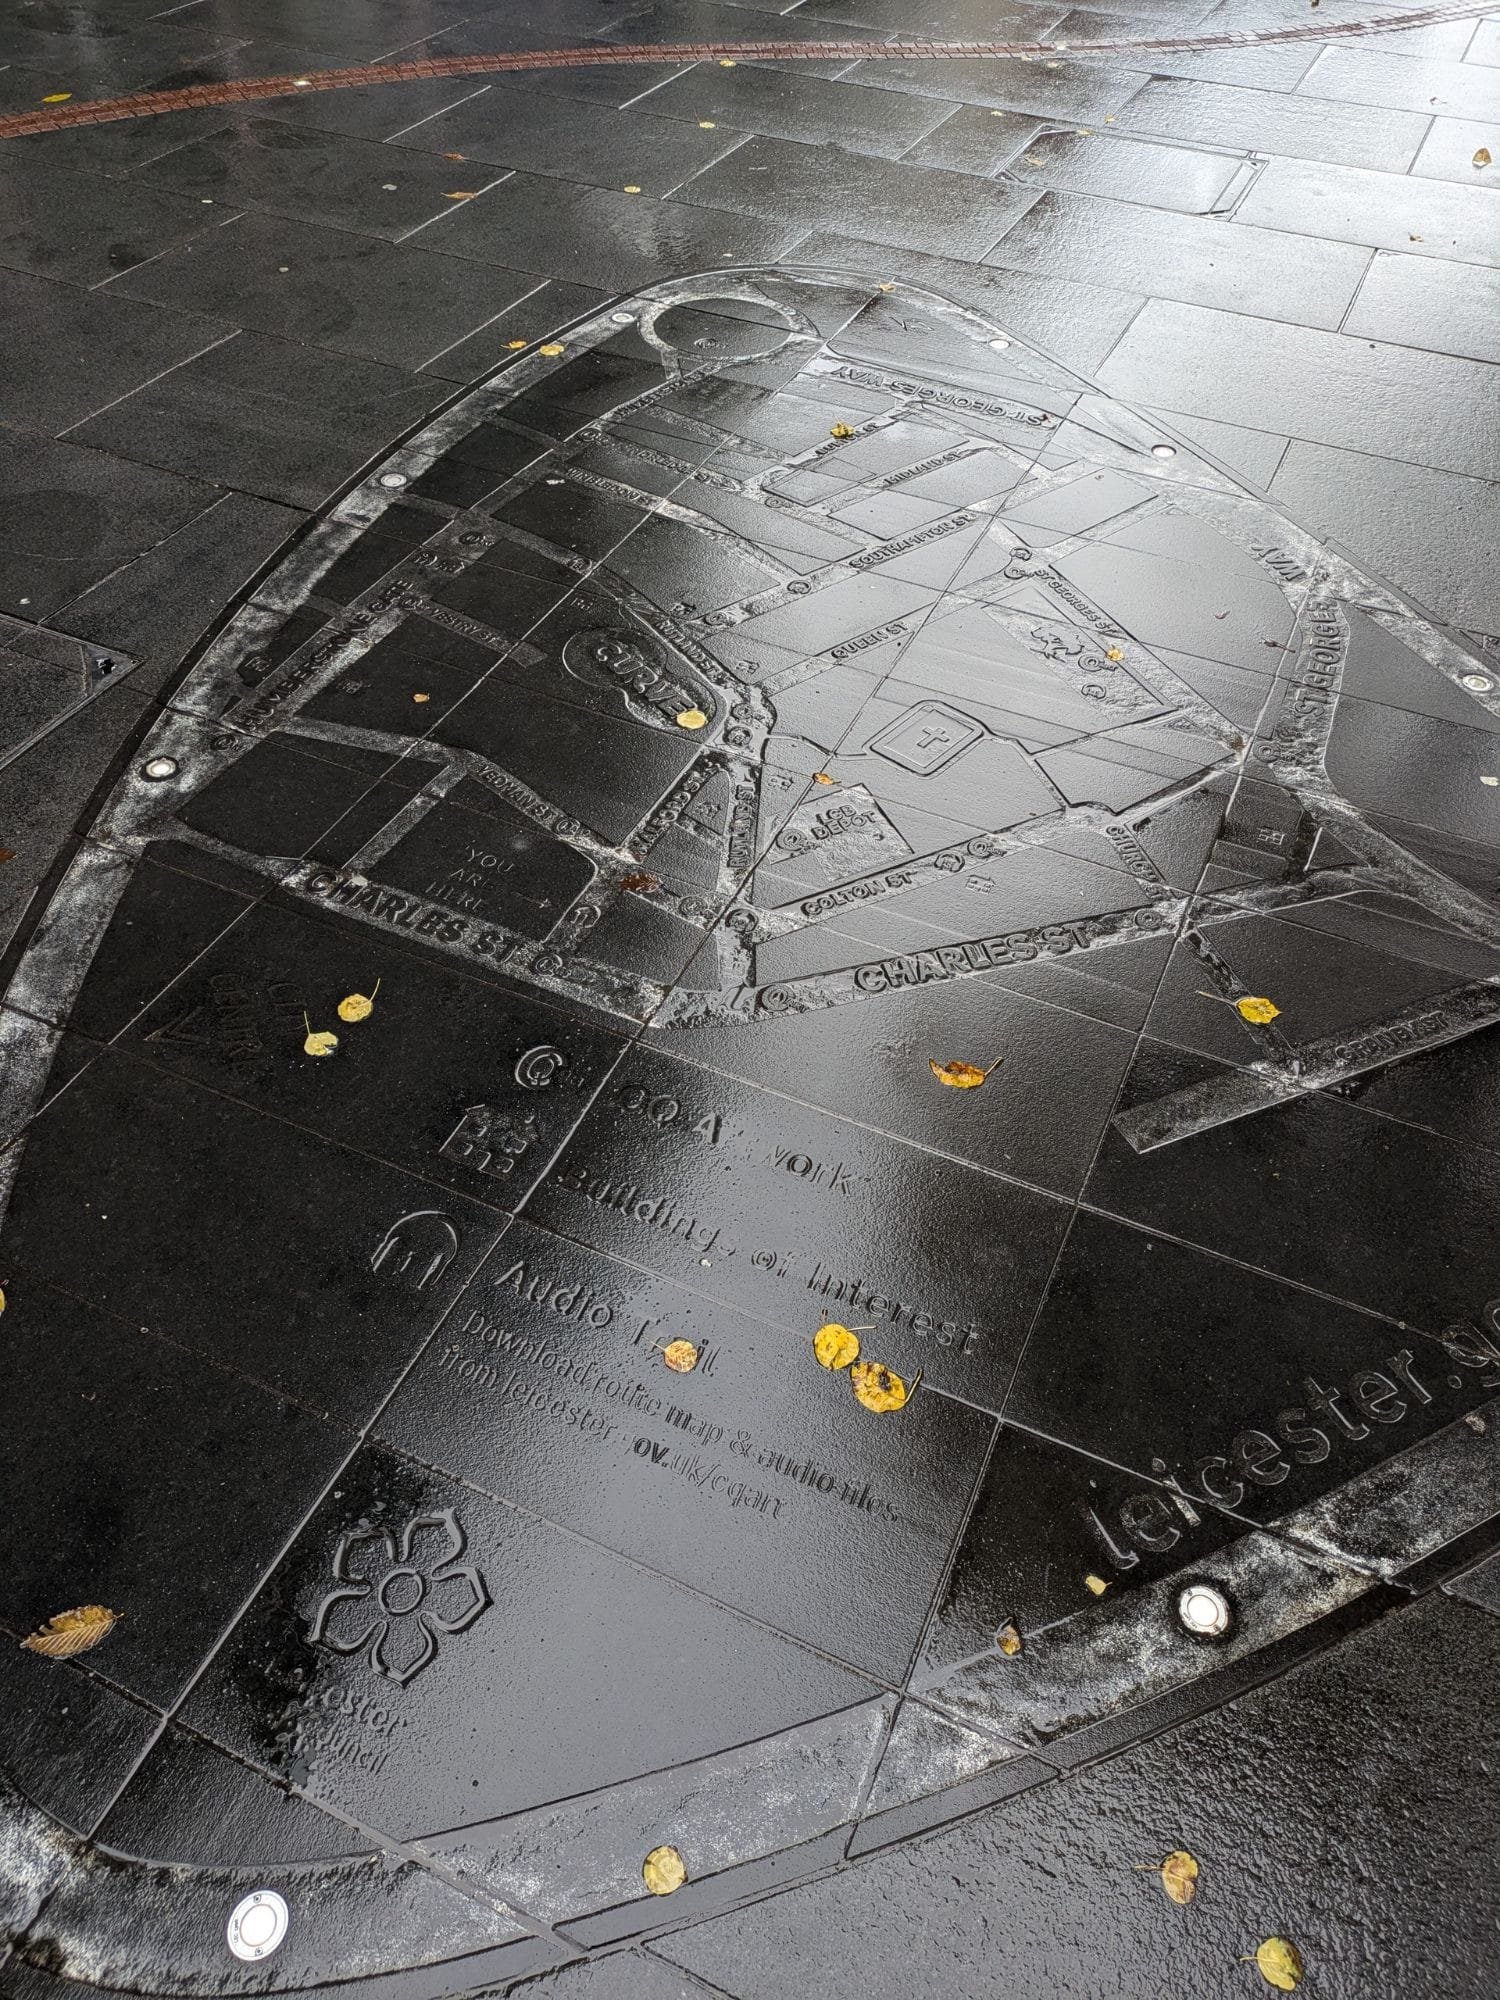

Dean shared this one of many maps of Leicester carved into the cities streets
-
sur Mappery: World on the clock
Publié: 25 January 2025, 12:00pm CET

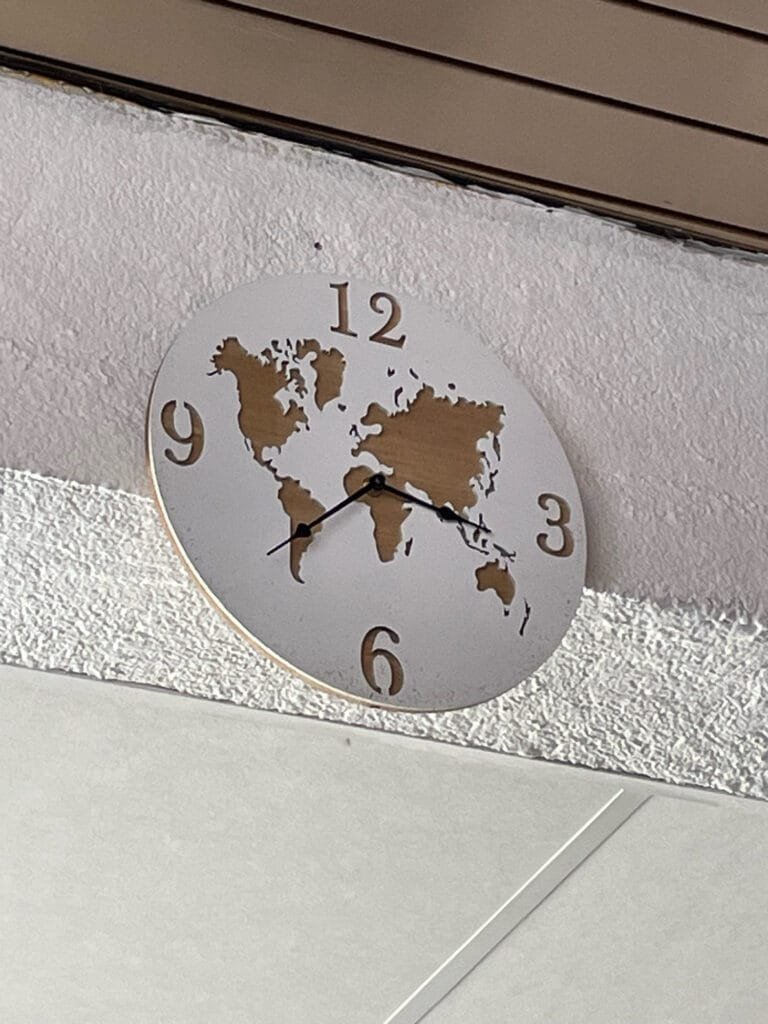
Another one from Le Cartographe
-
sur Mappery: Costers and Globe
Publié: 24 January 2025, 12:00pm CET
-
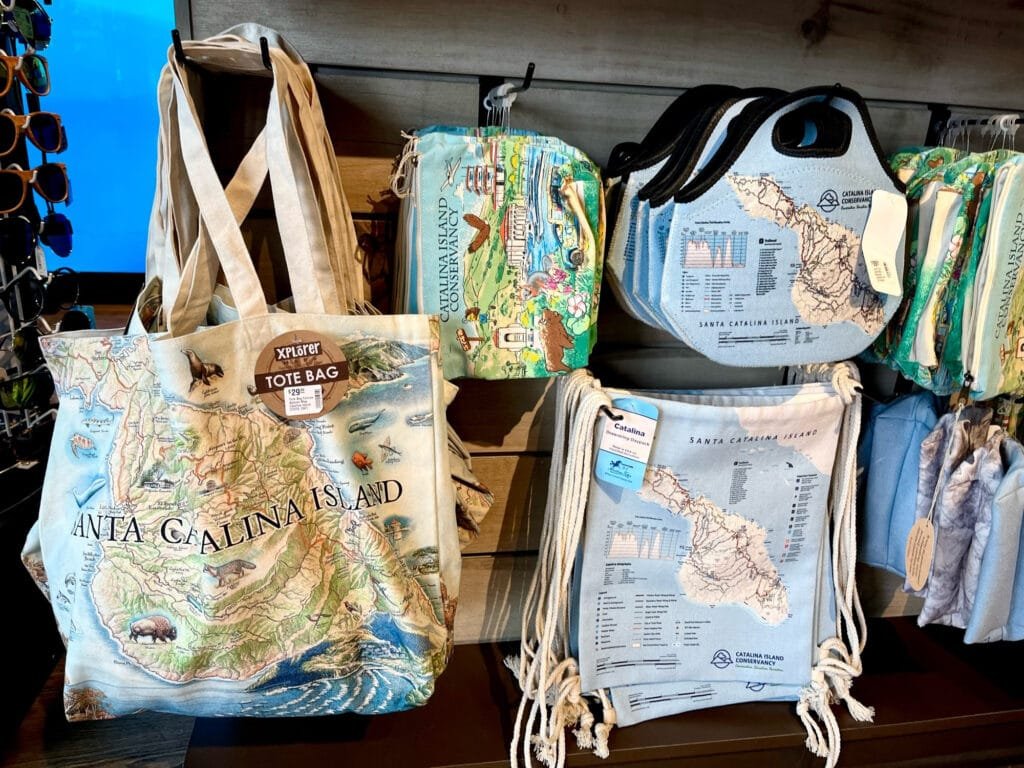
sur Mappery: All about Santa Catalina
Publié: 23 January 2025, 12:00pm CET


I want to thank ?Wanmei for sharing this coaster and the other photos. As a MacOS user, I knew about Catalina, and I still use the beautiful photo as a background. I am happy to share the maps of this Island.
-
sur Mappery: The map is not the territory
Publié: 22 January 2025, 12:00pm CET
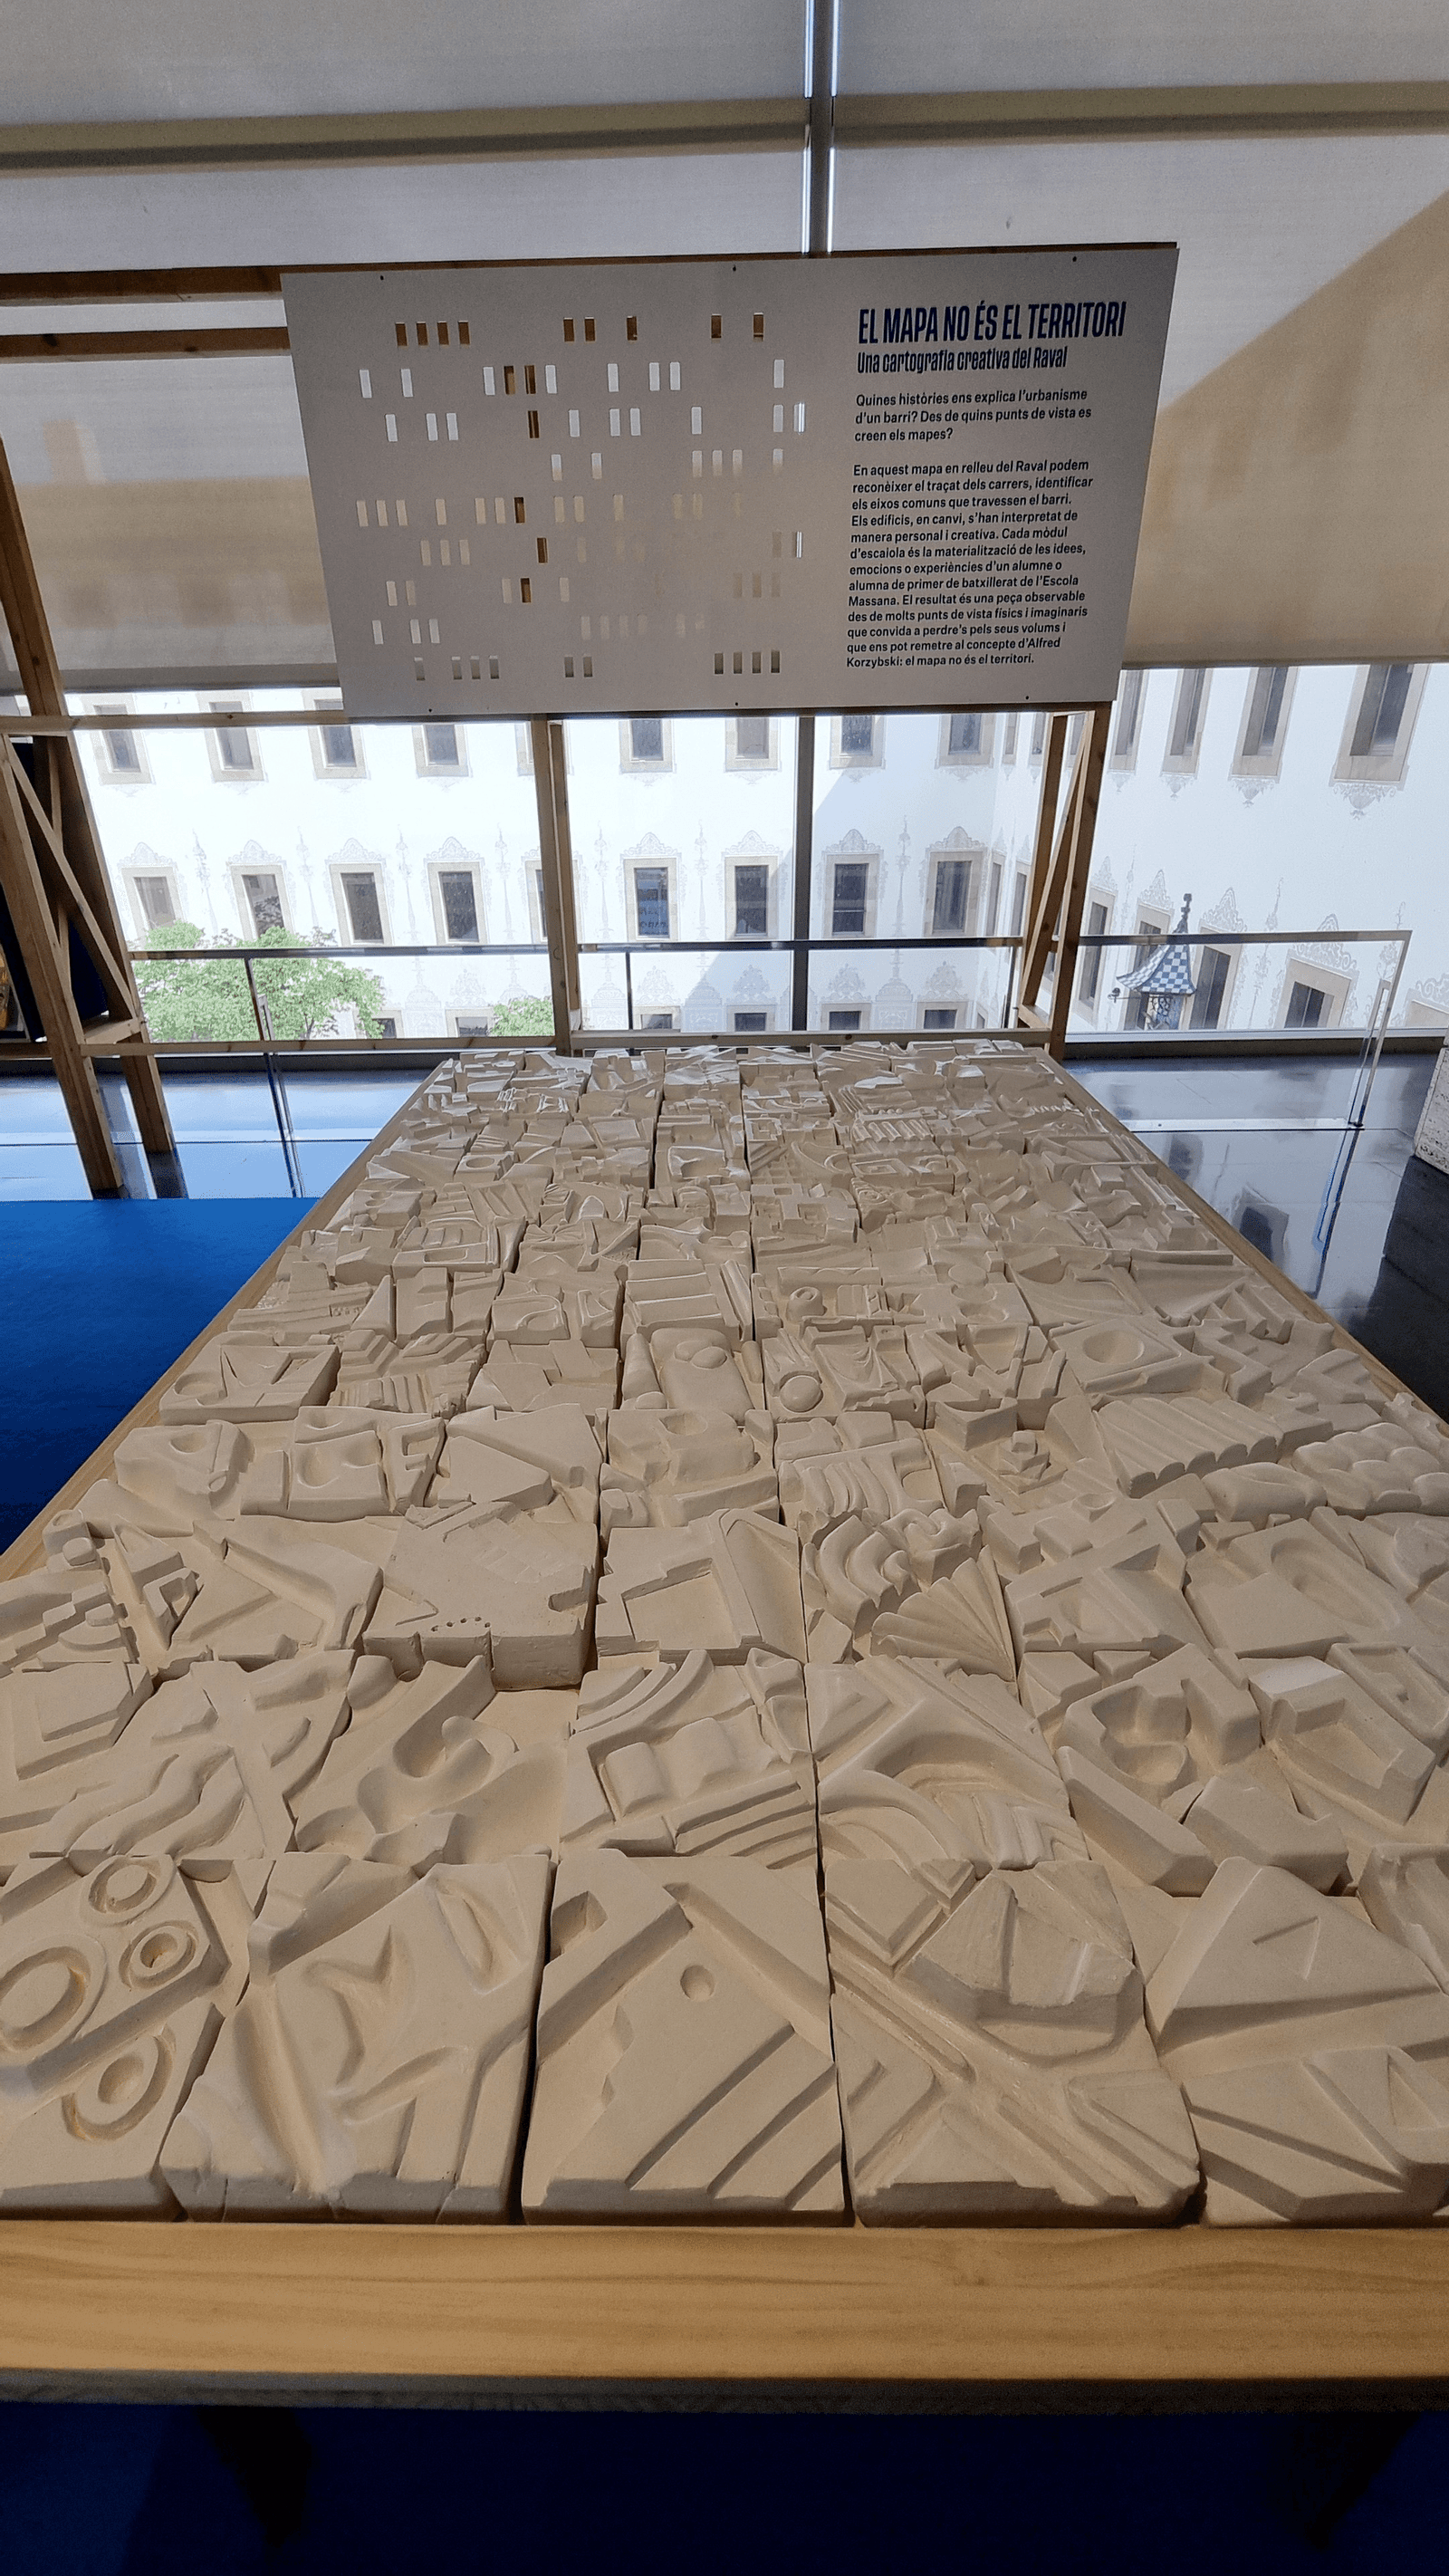
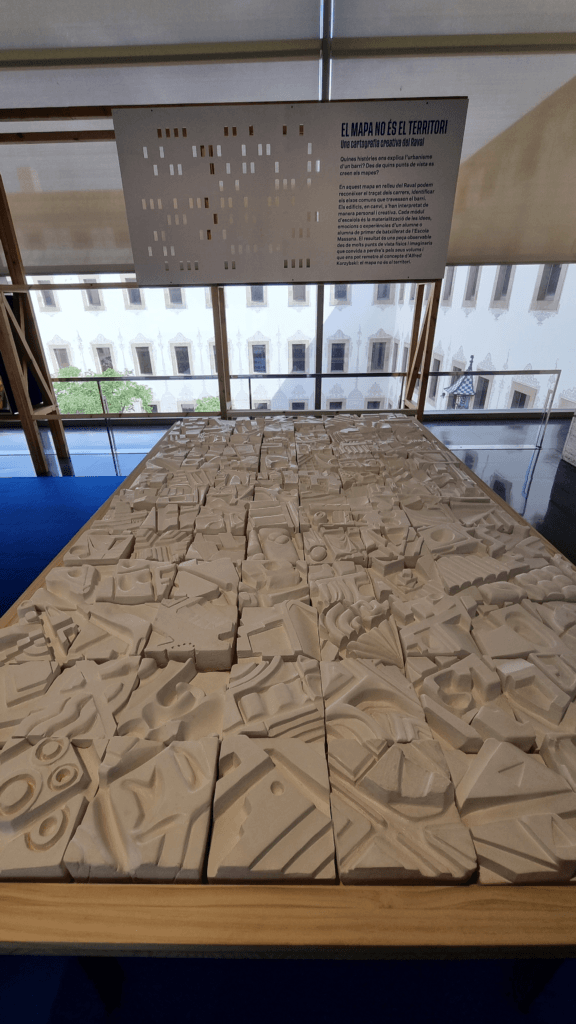
“El mapa no és el territori. Una cartografia creativa del Raval” is a piece observable from many physical and imaginary points of view of Raval neighbourhood in Barcelona – from Raf of course, our number one correspondent in Barcelona!
-
sur Mappery: Pilot’s Guide
Publié: 21 January 2025, 12:00pm CET
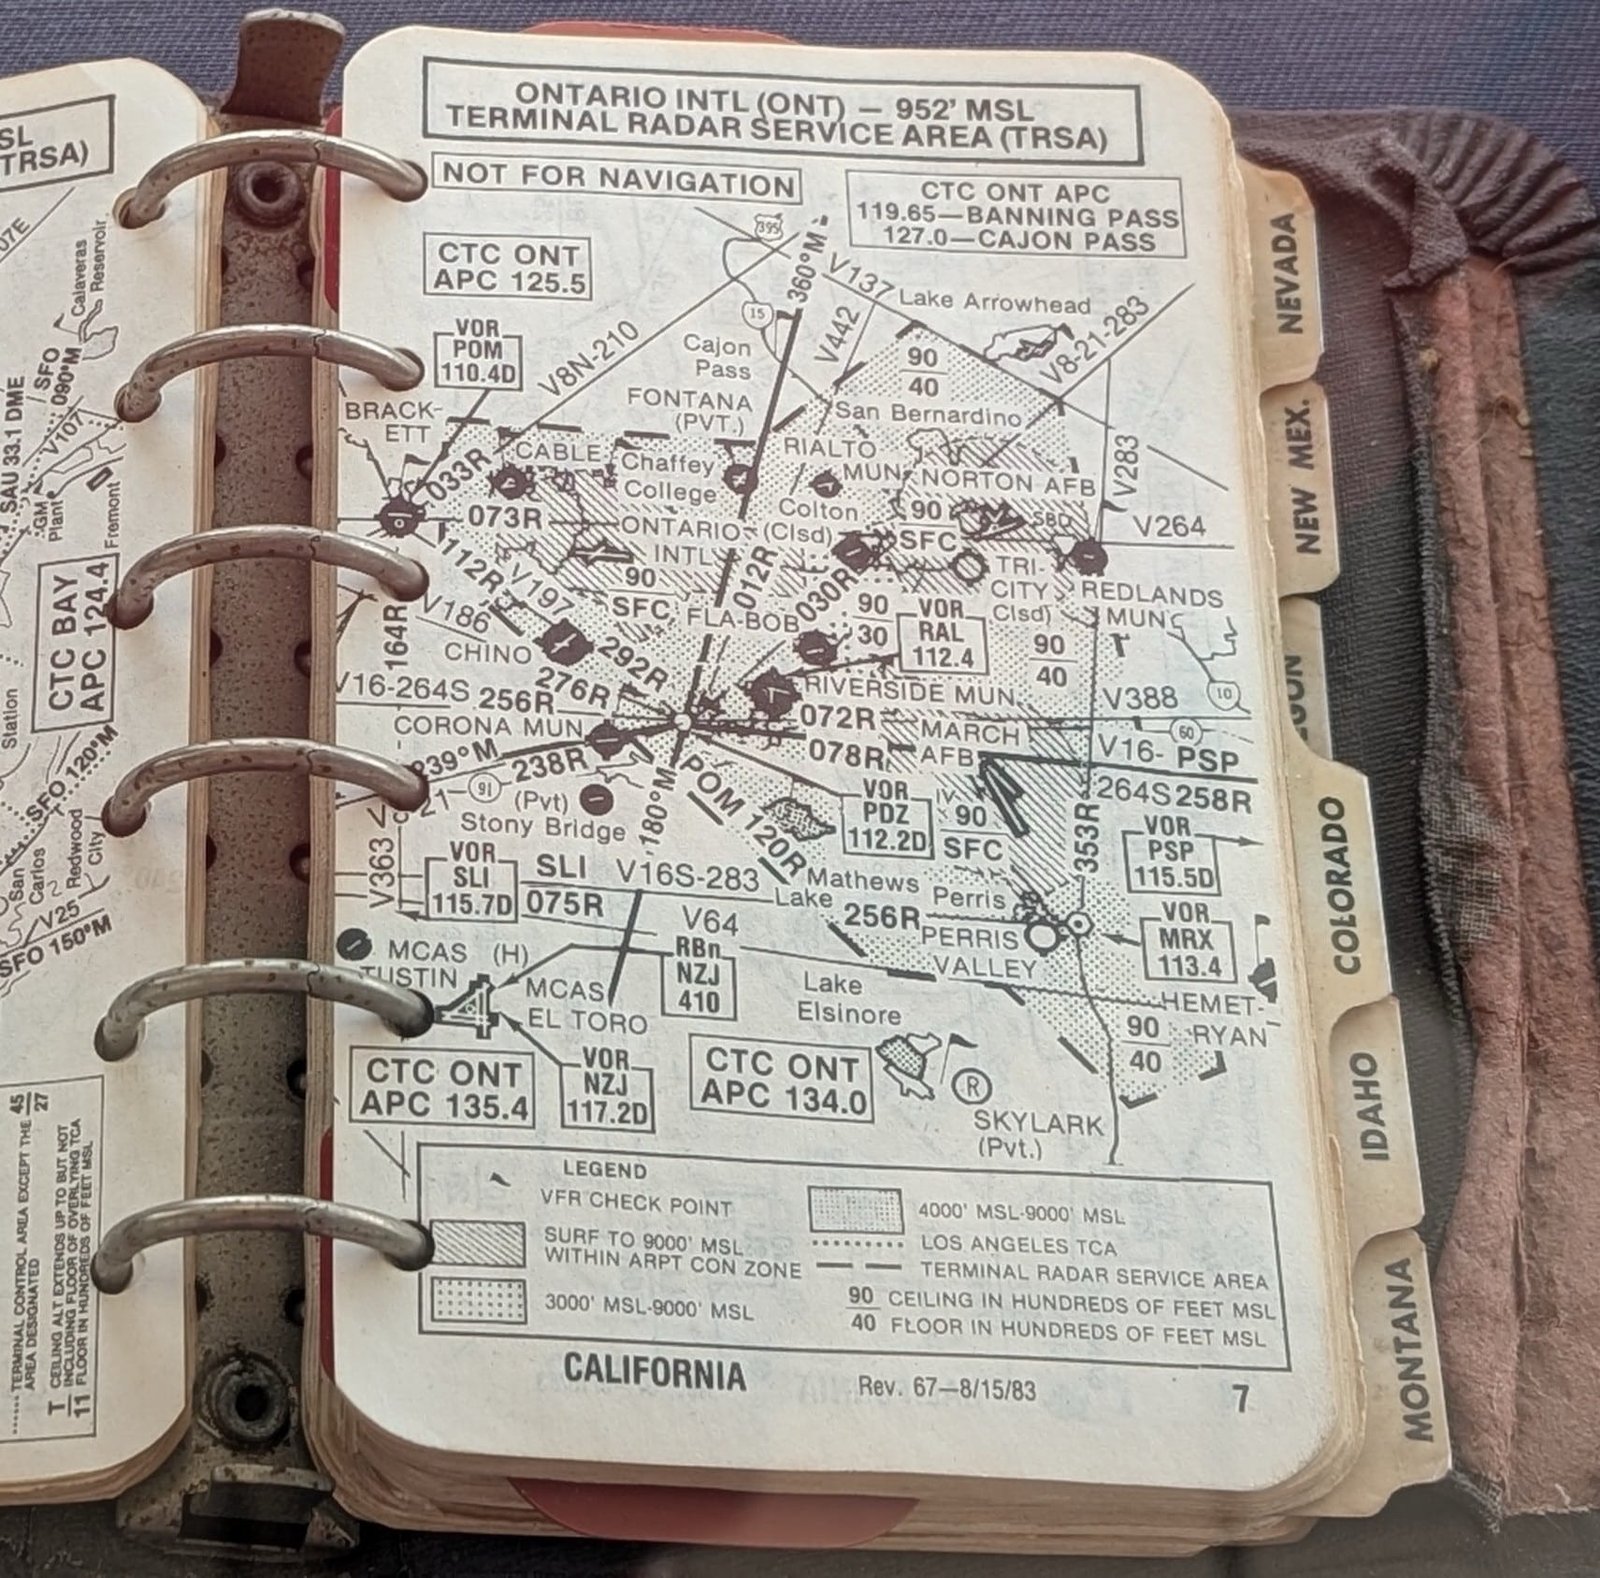

We haven’t had anything from Ken for a while, so let’s remedy that with this 1964 pilot’s guide marked “Not for navigation”
-
sur GeoSolutions: GeoServer 3 Crowdfunding Reaches Major Step: 80% Funding Completion
Publié: 21 January 2025, 11:00am CET
You must be logged into the site to view this content.
-
sur GeoCat: GeoServer 3 Crowdfunding Campaign Reaches Major Step: 80% Funding Completion
Publié: 21 January 2025, 11:00am CET
The GeoServer 3 crowdfunding campaign has made remarkable progress, reaching 80% of its financing goal. A significant boost came from a single €100,000 pledge, underscoring the value of this essential upgrade to the GeoServer platform. With just €112,000 left to raise, now is the time to join the movement and ensure the success of this critical project.
A Campaign with Global Outreach
This initiative, led by a consortium of 3 key companies Camptocamp, GeoCat, and GeoSolutions, has garnered backing from a wide range of contributors, including public institutions, large companies, SMEs and individuals from various countries. The campaign’s extensive outreach demonstrates GeoServer’s importance to a broad spectrum of users worldwide. GeoServer has become a cornerstone in geospatial applications across industries and borders, and this campaign reflects its far-reaching impact.
Why GeoServer 3 MattersThe necessity of implementing GeoServer 3 has never been greater. This major upgrade will deliver:
- Future-proof performance to handle growing data and processing demands.
- Enhanced image processing for better visualization and analysis.
- Improved security to safeguard critical geospatial systems.
- A modernized user experience for easier access and usability.
Without these enhancements, users and providers risk facing limitations in scalability, performance, functionality, and security. Achieving this upgrade will ensure GeoServer remains a leading tool in the geospatial industry, empowering your open-source Spatial Data Infrastructure (SDI) based on GeoServer to innovate continuously while providing secure, high-performance services. This will position your organization at the forefront of geospatial technology.
A Few More Months to Make a DifferenceThe campaign will continue until spring, providing a limited window for additional financial contributions. While the international team of core contributors is ready to start the migration, we are waiting for the complete budget allocation to begin, in line with the rules of this crowdfunding campaign. To accommodate many entities currently finalizing their budgets, we have planned to let the campaign run for a few more months. This is an excellent opportunity for your organization to support the future of GeoServer and demonstrate your commitment to open-source geospatial solutions.
Every Contribution CountsWith €112,000 still needed to meet the target, every pledge—big or small—matters. Whether you’re a public institution, a large company or an SME, your support can make a difference. Reaching this goal would be a remarkable achievement, building on the strong progress made so far and ensuring the future of GeoServer 3 becomes a reality.
For any questions or to discuss how you can contribute, please email us or fill out the form to pledge your support. Together, we can achieve this milestone and continue building a sustainable, innovative future for geospatial technology.
Thanks to all organizations and individuals that have mobilized themselves, contributed financially, or spread the word to make this campaign a success.

Individual donations: Abhijit Gujar, Laurent Bourgès.
The post GeoServer 3 Crowdfunding Campaign Reaches Major Step: 80% Funding Completion appeared first on GeoCat bv.
-
sur GeoServer Team: GeoServer 3 Crowdfunding Campaign Reaches Major Step: 80% Funding Completion
Publié: 21 January 2025, 2:00am CET
The GeoServer 3 crowdfunding campaign has made remarkable progress, reaching 80% of its financing goal. A significant boost came from a single €100,000 pledge, underscoring the value of this essential upgrade to the GeoServer platform. With just €112,000 left to raise, now is the time to join the movement and ensure the success of this critical project.
A Campaign with Global Outreach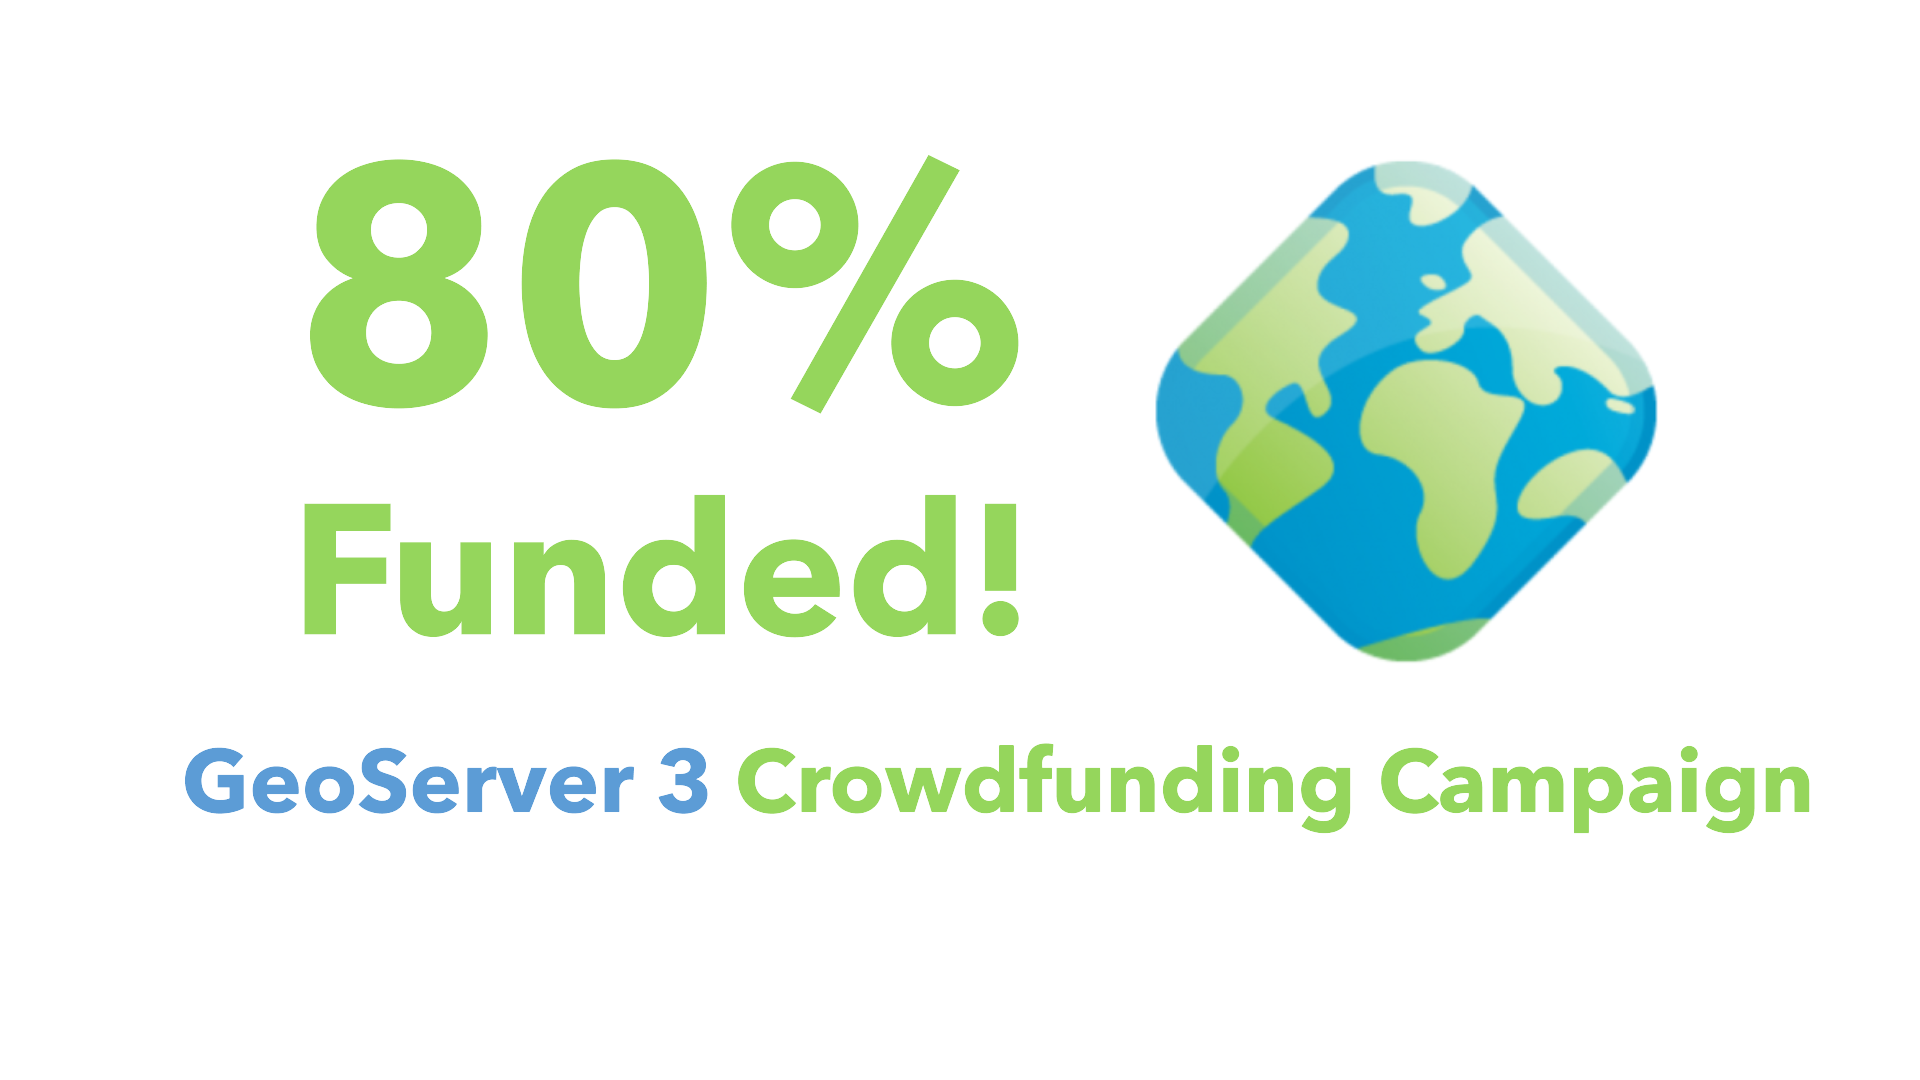
This initiative, led by a consortium of 3 key companies Camptocamp, GeoCat, and GeoSolutions, has garnered backing from a wide range of contributors, including public institutions, large companies, SMEs and individuals from various countries. The campaign’s extensive outreach demonstrates GeoServer’s importance to a broad spectrum of users worldwide. GeoServer has become a cornerstone in geospatial applications across industries and borders, and this campaign reflects its far-reaching impact.
Why GeoServer 3 MattersThe necessity of implementing GeoServer 3 has never been greater. This major upgrade will deliver:
- Future-proof performance to handle growing data and processing demands.
- Enhanced image processing for better visualization and analysis.
- Improved security to safeguard critical geospatial systems.
- A modernized user experience for easier access and usability.
Without these enhancements, users and providers risk facing limitations in scalability, performance, functionality, and security. Achieving this upgrade will ensure GeoServer remains a leading tool in the geospatial industry, empowering your open-source Spatial Data Infrastructure (SDI) based on GeoServer to innovate continuously while providing secure, high-performance services. This will position your organization at the forefront of geospatial technology.
A Few More Months to Make a DifferenceThe campaign will continue until spring, providing a limited window for additional financial contributions. While the international team of core contributors is ready to start the migration, we are waiting for the complete budget allocation to begin, in line with the rules of this crowdfunding campaign. To accommodate many entities currently finalizing their budgets, we have planned to let the campaign run for a few more months. This is an excellent opportunity for your organization to support the future of GeoServer and demonstrate your commitment to open-source geospatial solutions.
Every Contribution CountsWith €112,000 still needed to meet the target, every pledge—big or small—matters. Whether you’re a public institution, a large company or an SME, your support can make a difference. Reaching this goal would be a remarkable achievement, building on the strong progress made so far and ensuring the future of GeoServer 3 becomes a reality.
For any questions or to discuss how you can contribute, please email us or fill out the form to pledge your support. Together, we can achieve this milestone and continue building a sustainable, innovative future for geospatial technology.
Thanks to all organizations and individuals that have mobilized themselves, contributed financially, or spread the word to make this campaign a success.
The following organisations have pledged their support:


Individual donations: Abhijit Gujar, Laurent Bourgès.
-
sur Mappery: Catalonian Fish
Publié: 20 January 2025, 12:00pm CET

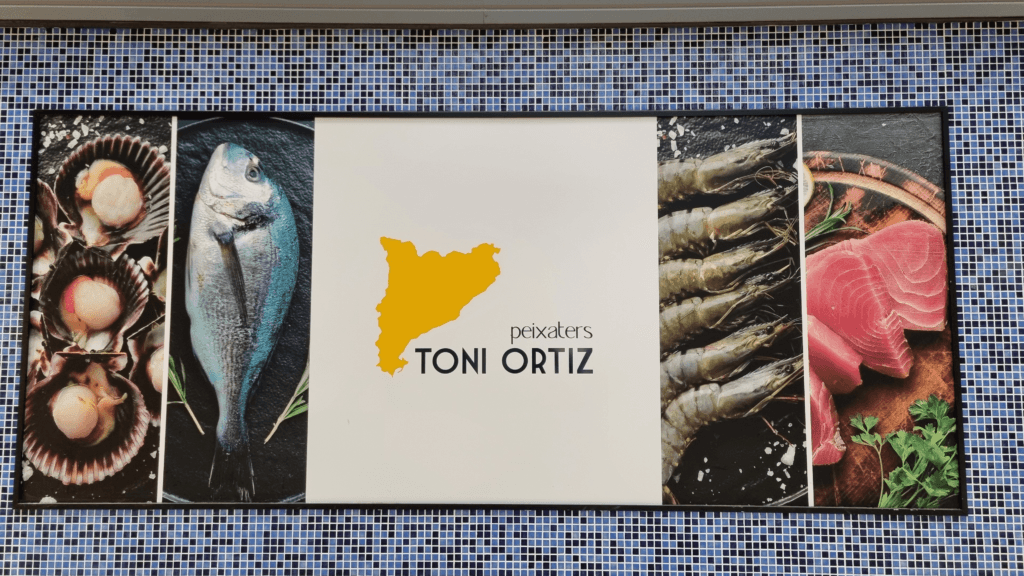
Fish stand inside food market in Reus, Catalunya via Raf. Seems like even the fish want independence
-
sur Mappery: Roads and Rails
Publié: 19 January 2025, 12:00pm CET
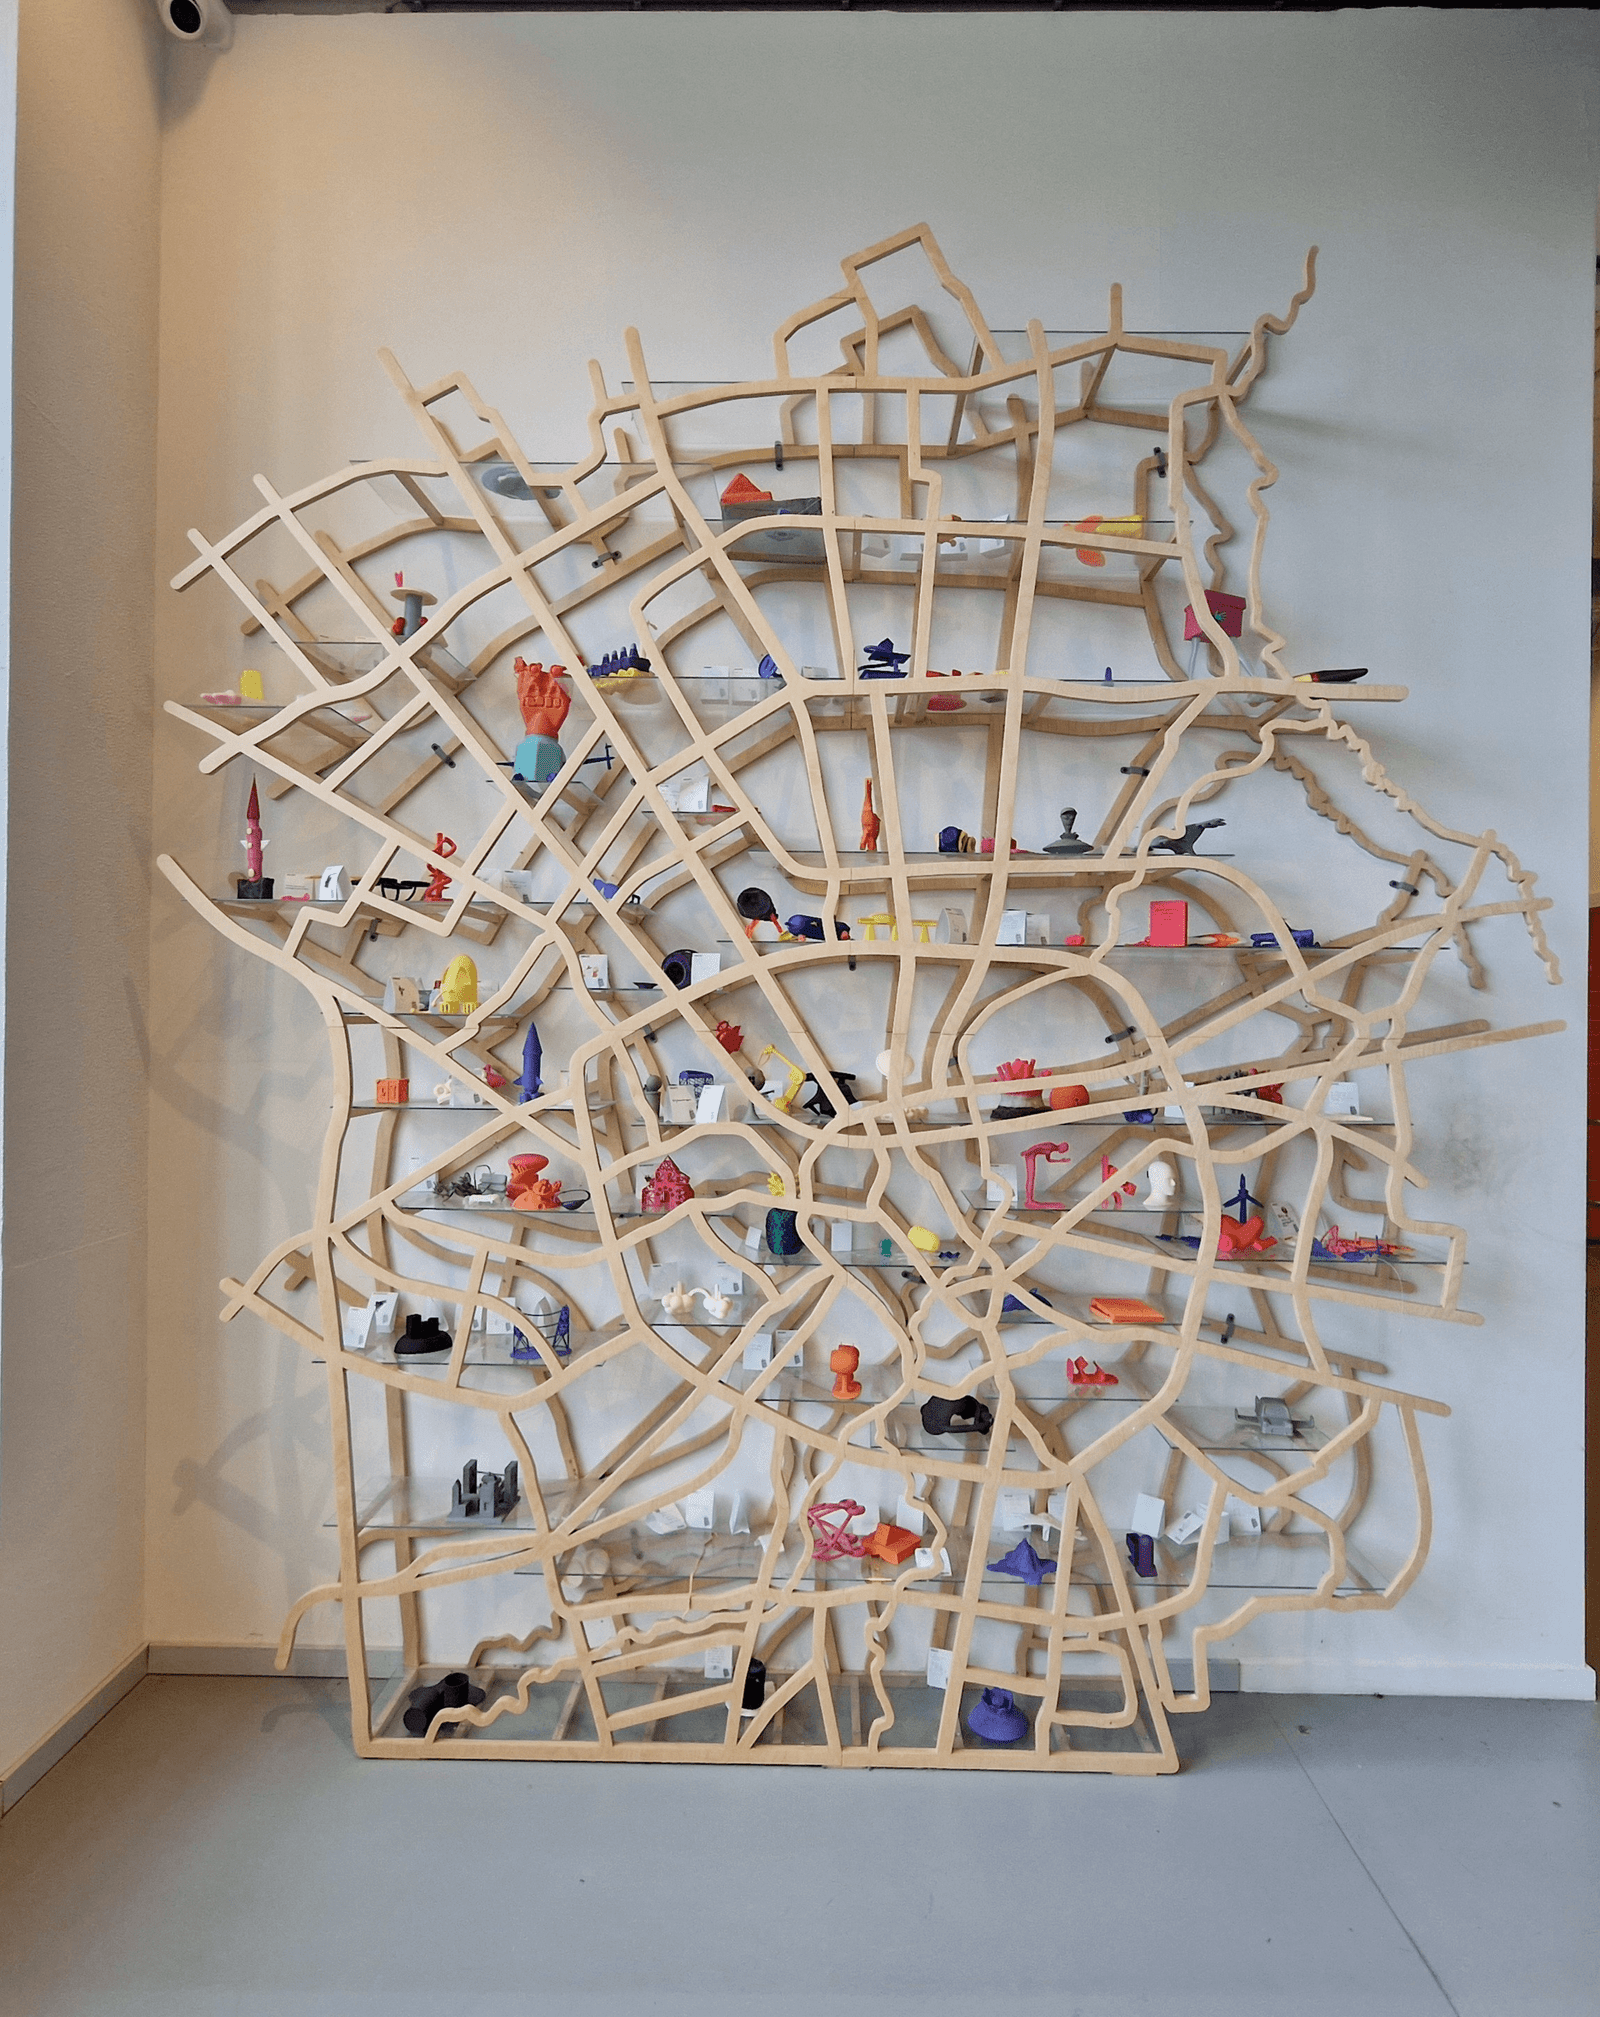
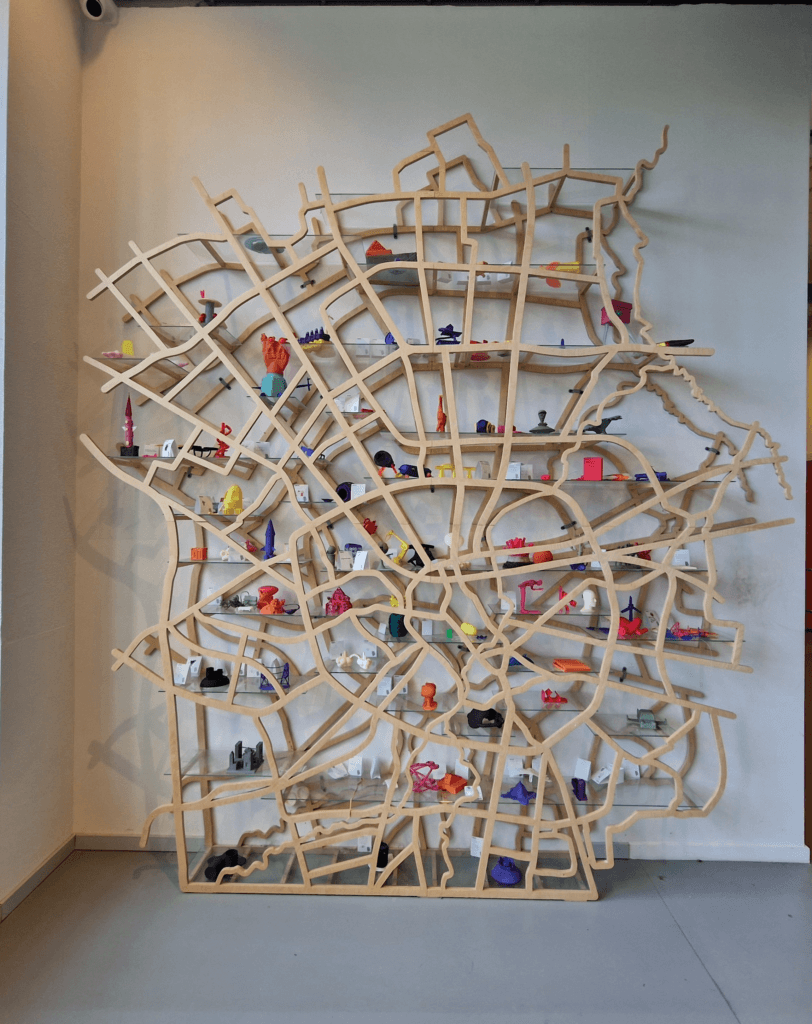
Garrett Speed spotted this shelving system in the Eindhoven Library. “Road and rails as a shelf in Eindhoven’s library, currently displaying 3D prints”
-
sur Mappery: Map Baggage
Publié: 18 January 2025, 12:00pm CET


Raf spotted these elegant mappy bags
-
sur PostGIS Development: PostGIS 3.5.2
Publié: 18 January 2025, 2:00am CET
The PostGIS Team is pleased to release PostGIS 3.5.2.
This version requires PostgreSQL 12 - 17, GEOS 3.8 or higher, and Proj 6.1+. To take advantage of all features, GEOS 3.12+ is needed. SFCGAL 1.4+ is needed to enable postgis_sfcgal support. To take advantage of all SFCGAL features, SFCGAL 1.5+ is needed.
3.5.2-
Cheat Sheets:
This release is a bug fix release that includes bug fixes since PostGIS 3.5.1.
-
sur Mappery: Mapped in Cardboard
Publié: 17 January 2025, 12:00pm CET
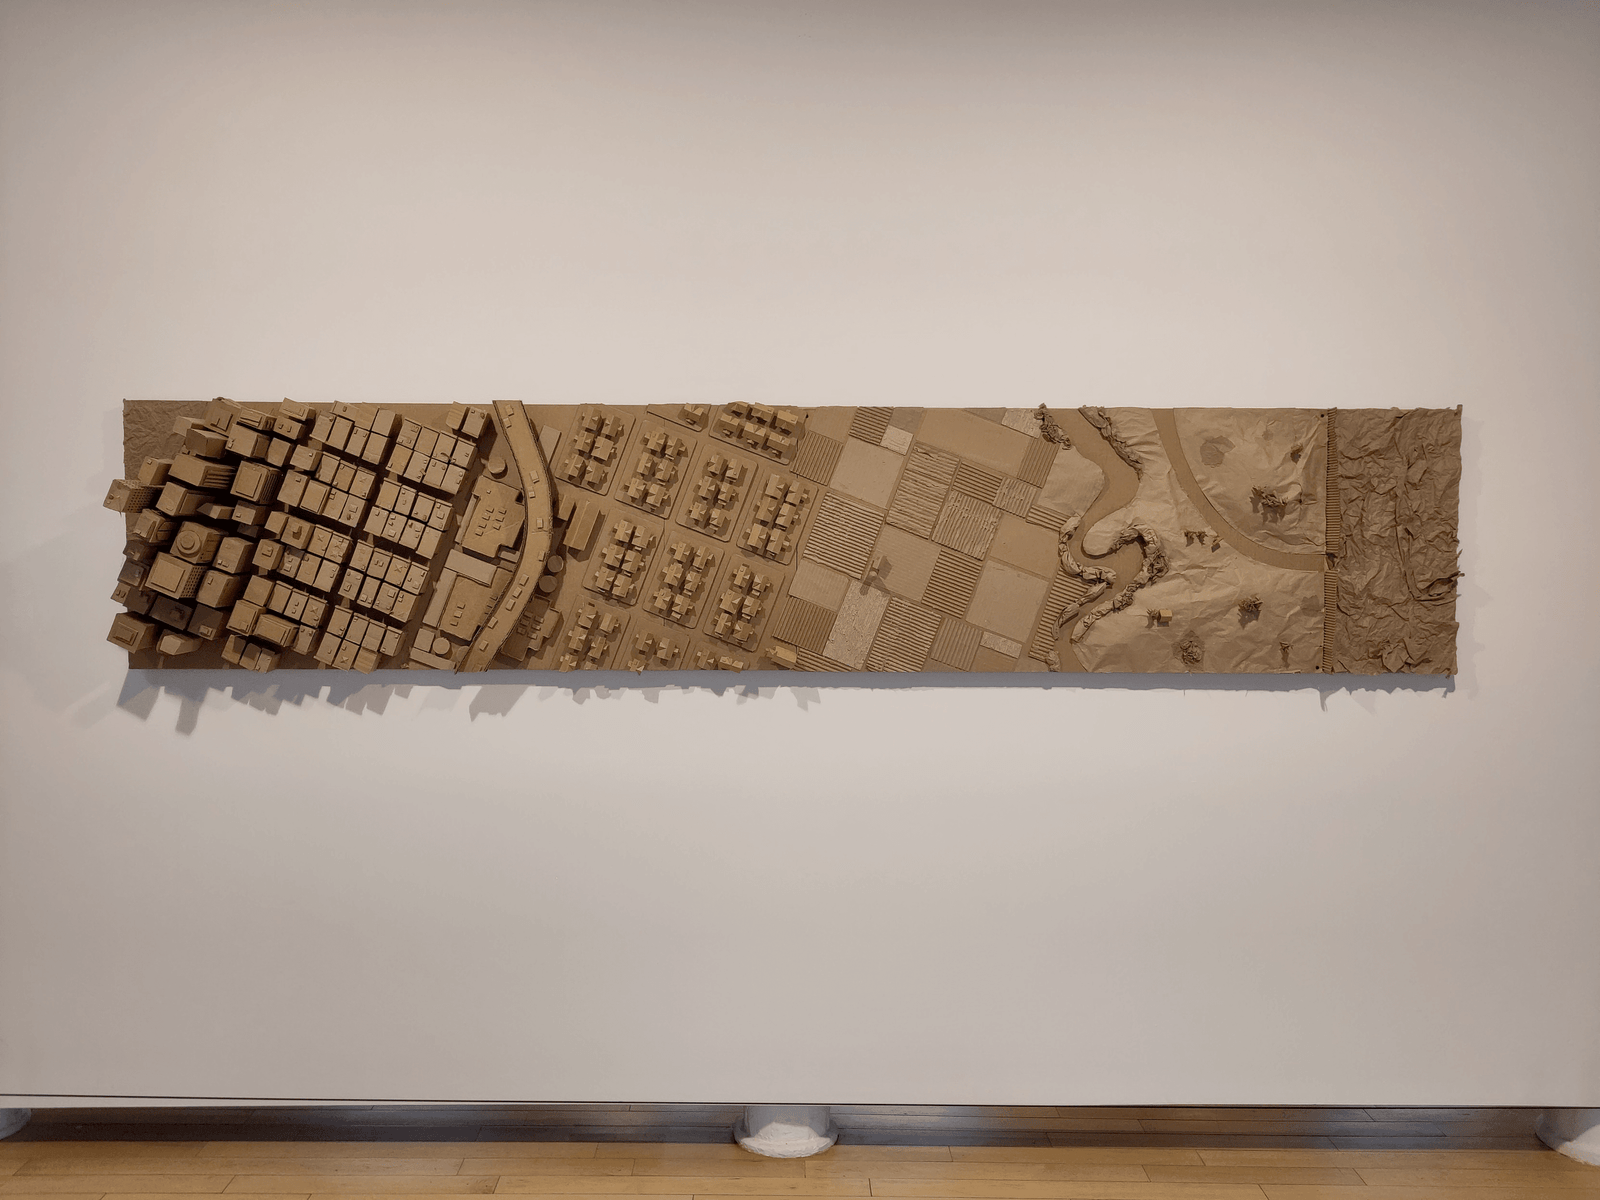
Wijfi said “I think this counts as a @mappery #mapsinthewild even though it’s a pretend place. Seen at #massmoca

“Known for her rich aesthetic and highly detailed constructions, Robin Frohardt is a theater and film director whose work uses recognizable materials-often trash- to create richly detailed worlds that consider the relationship between capitalism and the resulting environmental catastrophe. The tactile quality of cardboard, the low-fi animation effects, rich sound, and dynamic lighting combine to create a cinematic expression that defies the humbleness of the material. Frohardt began using cardboard with the Cardboard Institute of Technology, a collective of artists creating immersive cardboard environments in San Francisco in the early 2000s. Her first cardboard film, Fitzcardboardaldo, premiered in 2013 at the Telluride Film Festival. Seen here is her second cardboard film, Bag, which premiered in 2018 and is a part of her larger work, The Plastic Bag Store.”

A close up view of what the cardboard map looks like from the city looking out towards the countryside.
-
sur Kartoza: Rendering Points as a Heatmap in GeoServer
Publié: 17 January 2025, 2:00am CET
Rendering Points as a Heatmap in GeoServerI was assigned the task of rendering a points layer as a heatmap on GeoServer. The client provided a QGIS style that they wanted replicated using an SLD (Styled Layer Descriptor). Initially, they attempted to export the QGIS style directly as an SLD and upload it to GeoServer. However, this approach failed because QGIS generated the heatmap SLD as:
<?xml version="1.0" encoding="UTF-8"?><StyledLayerDescriptor xmlns="http://www.opengis.net/sld" xsi:schemaLocation="http://www.opengis.net/sld [schemas.opengis.net] xmlns:xlink="http://www.w3.org/1999/xlink" xmlns:xsi="http://www.w3.org/2001/XMLSchema-instance" version="1.1.0" xmlns:ogc="http://www.opengis.net/ogc" xmlns:se="http://www.opengis.net/se"> <NamedLayer> <se:Name>Current_Layer</se:Name> <UserStyle> <se:Name>Current_style</se:Name> <se:FeatureTypeStyle> <!--FeatureRenderer heatmapRenderer not implemented yet--> </se:FeatureTypeStyle> </UserStyle> </NamedLayer></StyledLayerDescriptor>
The main issue was the line:
<!--FeatureRenderer heatmapRenderer not implemented yet-->
, indicating that the style was essentially saved as blank or non-renderable. This was simply how the style was exported from QGIS.
The first step in addressing the request was to visit the GeoServer Styling Manual and see if there was any example documentation that could help. There was an explanation of how to generate a heatmap style in the Rendering Transformations' Heatmap Generation documentation as well as an example of a heatmap SLD.
Using the example from the documentation as a basis, I made a few adjustments to ensure the style met the client’s requirements. Here is what the initial heatmap style looked like:
<?xml version="1.0" encoding="ISO-8859-1"?><StyledLayerDescriptor version="1.0.0" xsi:schemaLocation="http://www.opengis.net/sld StyledLayerDescriptor.xsd" xmlns="http://www.opengis.net/sld" xmlns:ogc="http://www.opengis.net/ogc" xmlns:xlink="http://www.w3.org/1999/xlink" xmlns:xsi="http://www.w3.org/2001/XMLSchema-instance"> <NamedLayer> <Name>Heatmap Style</Name> <UserStyle> <Title>Heatmap Style</Title> <Abstract></Abstract> <FeatureTypeStyle> <Transformation> <ogc:Function name="vec:Heatmap"> <ogc:Function name="parameter"> <ogc:Literal>data</ogc:Literal> </ogc:Function> <ogc:Function name="parameter"> <ogc:Literal>weightAttr</ogc:Literal> <ogc:Literal>geometry</ogc:Literal> </ogc:Function> <ogc:Function name="parameter"> <ogc:Literal>radiusPixels</ogc:Literal> <ogc:Literal>75</ogc:Literal> <!-- Spread of heatmap around points, set a number below 100 to reduce spread of heatmap --> </ogc:Function> <ogc:Function name="parameter"> <ogc:Literal>pixelsPerCell</ogc:Literal> <ogc:Literal>5</ogc:Literal> <!-- Set a small number here to generate a higher resolution heatmap --> </ogc:Function> <ogc:Function name="parameter"> <ogc:Literal>outputBBOX</ogc:Literal> <ogc:Function name="env"> <ogc:Literal>wms_bbox</ogc:Literal> </ogc:Function> </ogc:Function> <ogc:Function name="parameter"> <ogc:Literal>outputWidth</ogc:Literal> <ogc:Function name="env"> <ogc:Literal>wms_width</ogc:Literal> </ogc:Function> </ogc:Function> <ogc:Function name="parameter"> <ogc:Literal>outputHeight</ogc:Literal> <ogc:Function name="env"> <ogc:Literal>wms_height</ogc:Literal> </ogc:Function> </ogc:Function> </ogc:Function> </Transformation> <Rule> <RasterSymbolizer> <Geometry> <ogc:PropertyName>geometry</ogc:PropertyName> </Geometry> <Opacity>0.5</Opacity> <ColorMap type="ramp"> <!-- The quantity specifies the percentage of the data range on which to change the colour --> <ColorMapEntry color="#FFFFFF" quantity="0" label="" opacity="0"/> <!-- This is needed to have empty areas around the heatmap 'islands' --> <ColorMapEntry color="#4444FF" quantity=".1" label=""/> <ColorMapEntry color="#00FFAE" quantity=".3" label=""/> <ColorMapEntry color="#FF0000" quantity=".5" label="" /> <ColorMapEntry color="#FFAE00" quantity=".75" label=""/> <ColorMapEntry color="#FFFF00" quantity="1.0" label="" /> </ColorMap> </RasterSymbolizer> </Rule> </FeatureTypeStyle> </UserStyle> </NamedLayer></StyledLayerDescriptor>
Inline comments were added to the SLD to help the client understand which lines they could modify if needed.
The primary adjustments made to the example style are as follows:
- Setting the `weightAttr` as `geometry` so that specified input attribute is the geometry of the various points.
- Adjusting the `radiusPixels` and the `pixelsPerCell` values.
- Adding additional stops in the colour ramp.
- Changing the hexcodes of the colours in the colour ramp to be the same as the example heatmap.
While generating the heatmap style, an issue frequently occurred with GeoServer’s built-in style previewer, which did not display the style accurately. As a result, I had to check the results on the front-end map after every change. This limitation is evident in the screenshot below, where the GeoServer preview lacks a proper front-end to display the styled dummy data, making it appear different from how it would look on an actual map.
The generated heatmap looked like this when rendered correctly (this is dummy data and not the actual data):

The client was pleased with the heatmap but later requested additional functionality: displaying the relative counts of the various heatmap surfaces. This prompted me to research whether anyone had implemented something similar that I could use as a reference. After an extensive search yielded no results, I decided to experiment and create a custom SLD to meet the client’s requirements.
I had previously been shown and used the Point Stacker logic in GeoServer to do clustered symbol displays so I used this as my base logic. The whole logic behind the clustered labelling display didn't need to be complex. All the labels would be the same size, and font, and they just needed to display a relative count.
Given these criteria, I modified my existing Point Stacker logic to be simplified and it looked like this:
<FeatureTypeStyle> <Transformation> <ogc:Function name="gs:PointStacker"> <ogc:Function name="parameter"> <ogc:Literal>data</ogc:Literal> </ogc:Function> <ogc:Function name="parameter"> <ogc:Literal>cellSize</ogc:Literal> <ogc:Literal>20</ogc:Literal> </ogc:Function> <ogc:Function name="parameter"> <ogc:Literal>outputBBOX</ogc:Literal> <ogc:Function name="env"> <ogc:Literal>wms_bbox</ogc:Literal> </ogc:Function> </ogc:Function> <ogc:Function name="parameter"> <ogc:Literal>outputWidth</ogc:Literal> <ogc:Function name="env"> <ogc:Literal>wms_width</ogc:Literal> </ogc:Function> </ogc:Function> <ogc:Function name="parameter"> <ogc:Literal>outputHeight</ogc:Literal> <ogc:Function name="env"> <ogc:Literal>wms_height</ogc:Literal> </ogc:Function> </ogc:Function> </ogc:Function> </Transformation> <Rule> <Name>Clusters</Name> <Title>Clusters</Title> <ogc:Filter> <ogc:PropertyIsGreaterThanOrEqualTo> <ogc:PropertyName>count</ogc:PropertyName> <ogc:Literal>5</ogc:Literal> </ogc:PropertyIsGreaterThanOrEqualTo> </ogc:Filter> <TextSymbolizer> <Label> <ogc:PropertyName>count</ogc:PropertyName> </Label> <Font> <CssParameter name="font-family">Arial</CssParameter> <CssParameter name="font-size">10</CssParameter> <CssParameter name="font-weight">bold</CssParameter> </Font> <LabelPlacement> <PointPlacement> <AnchorPoint> <AnchorPointX>0</AnchorPointX> <AnchorPointY>0</AnchorPointY> </AnchorPoint> </PointPlacement> </LabelPlacement> <Halo> <Radius>0.4</Radius> <Fill> <CssParameter name="fill">#000000</CssParameter> <CssParameter name="fill-opacity">1</CssParameter> </Fill> </Halo> <Fill> <CssParameter name="fill">#FFFFFF</CssParameter> <CssParameter name="fill-opacity">1.0</CssParameter> </Fill> </TextSymbolizer> </Rule> </FeatureTypeStyle>
There is only one clustering rule as having different sized circles symbolizing different sized clusters was not needed. The `cellSize` was set to 20 map units so that all points within a grid cell of 20x20 map units get clustered together. The `count` property was set to be greater than or equal to 5, as during the creation of the style, it became apparent that labelling all of the clusters with fewer than 5 points overcrowded the map visually and did not add any more information.
The next step was combining the logic for the heatmap and the labelled clusters. After multiple failed attempts, I found that I couldn't combine the two logics into one `FeatureTypeStyle` and needed two separate `FeatureTypeStyle` groups. From there I then played around with the ordering of the `FeatureTypeStyle` logic and learnt that the heatmap style needed to come first in the SLD.
All the attempts led to this style:
<?xml version="1.0" encoding="ISO-8859-1"?> <StyledLayerDescriptor version="1.0.0" xsi:schemaLocation="http://www.opengis.net/sld StyledLayerDescriptor.xsd" xmlns="http://www.opengis.net/sld" xmlns:ogc="http://www.opengis.net/ogc" xmlns:xlink="http://www.w3.org/1999/xlink" xmlns:xsi="http://www.w3.org/2001/XMLSchema-instance" xmlns:se="http://www.opengis.net/se"> <NamedLayer> <Name>Cluster points</Name> <UserStyle> <!-- Styles can have names, titles and abstracts --> <Title>Clustered points</Title> <Abstract>Styling using cluster points server side</Abstract> <FeatureTypeStyle> <Transformation> <ogc:Function name="vec:Heatmap"> <ogc:Function name="parameter"> <ogc:Literal>data</ogc:Literal> </ogc:Function> <ogc:Function name="parameter"> <ogc:Literal>weightAttr</ogc:Literal> <ogc:Literal>geometry</ogc:Literal> </ogc:Function> <!-- Set a very small radius or remove this parameter --> <ogc:Function name="parameter"> <ogc:Literal>radiusPixels</ogc:Literal> <ogc:Literal>75</ogc:Literal> <!-- Reduced radius --> </ogc:Function> <ogc:Function name="parameter"> <ogc:Literal>pixelsPerCell</ogc:Literal> <ogc:Literal>5</ogc:Literal> </ogc:Function> <ogc:Function name="parameter"> <ogc:Literal>outputBBOX</ogc:Literal> <ogc:Function name="env"> <ogc:Literal>wms_bbox</ogc:Literal> </ogc:Function> </ogc:Function> <ogc:Function name="parameter"> <ogc:Literal>outputWidth</ogc:Literal> <ogc:Function name="env"> <ogc:Literal>wms_width</ogc:Literal> </ogc:Function> </ogc:Function> <ogc:Function name="parameter"> <ogc:Literal>outputHeight</ogc:Literal> <ogc:Function name="env"> <ogc:Literal>wms_height</ogc:Literal> </ogc:Function> </ogc:Function> </ogc:Function> </Transformation> <Rule> <RasterSymbolizer> <Geometry> <ogc:PropertyName>geometry</ogc:PropertyName> </Geometry> <Opacity>0.5</Opacity> <ColorMap type="ramp"> <ColorMapEntry color="#FFFFFF" quantity="0" label="" opacity="0"/> <ColorMapEntry color="#4444FF" quantity=".1" label=""/> <ColorMapEntry color="#00FFAE" quantity=".3" label=""/> <ColorMapEntry color="#FF0000" quantity=".5" label="" /> <ColorMapEntry color="#FFAE00" quantity=".75" label=""/> <ColorMapEntry color="#FFFF00" quantity="1.0" label="" /> </ColorMap> </RasterSymbolizer> </Rule> </FeatureTypeStyle> <!-- Clustering and labelling logic --> <FeatureTypeStyle> <Transformation> <ogc:Function name="gs:PointStacker"> <ogc:Function name="parameter"> <ogc:Literal>data</ogc:Literal> </ogc:Function> <ogc:Function name="parameter"> <ogc:Literal>cellSize</ogc:Literal> <ogc:Literal>20</ogc:Literal> </ogc:Function> <ogc:Function name="parameter"> <ogc:Literal>outputBBOX</ogc:Literal> <ogc:Function name="env"> <ogc:Literal>wms_bbox</ogc:Literal> </ogc:Function> </ogc:Function> <ogc:Function name="parameter"> <ogc:Literal>outputWidth</ogc:Literal> <ogc:Function name="env"> <ogc:Literal>wms_width</ogc:Literal> </ogc:Function> </ogc:Function> <ogc:Function name="parameter"> <ogc:Literal>outputHeight</ogc:Literal> <ogc:Function name="env"> <ogc:Literal>wms_height</ogc:Literal> </ogc:Function> </ogc:Function> </ogc:Function> </Transformation> <Rule> <Name>Clusters</Name> <Title>Clusters</Title> <ogc:Filter> <ogc:PropertyIsGreaterThanOrEqualTo> <ogc:PropertyName>count</ogc:PropertyName> <ogc:Literal>5</ogc:Literal> </ogc:PropertyIsGreaterThanOrEqualTo> </ogc:Filter> <TextSymbolizer> <Label> <ogc:PropertyName>count</ogc:PropertyName> </Label> <Font> <CssParameter name="font-family">Arial</CssParameter> <CssParameter name="font-size">10</CssParameter> <CssParameter name="font-weight">bold</CssParameter> </Font> <LabelPlacement> <PointPlacement> <AnchorPoint> <AnchorPointX>0</AnchorPointX> <AnchorPointY>0</AnchorPointY> </AnchorPoint> </PointPlacement> </LabelPlacement> <Halo> <Radius>0.4</Radius> <Fill> <CssParameter name="fill">#000000</CssParameter> <CssParameter name="fill-opacity">1</CssParameter> </Fill> </Halo> <Fill> <CssParameter name="fill">#FFFFFF</CssParameter> <CssParameter name="fill-opacity">1.0</CssParameter> </Fill> </TextSymbolizer> </Rule> </FeatureTypeStyle> </UserStyle> </NamedLayer></StyledLayerDescriptor>
This style renders the points as a heatmap using the `geometry` attribute for weighting and then displays labels for clusters of points that are larger than 5. It looks like this (Again, this is dummy data and not the actual data):
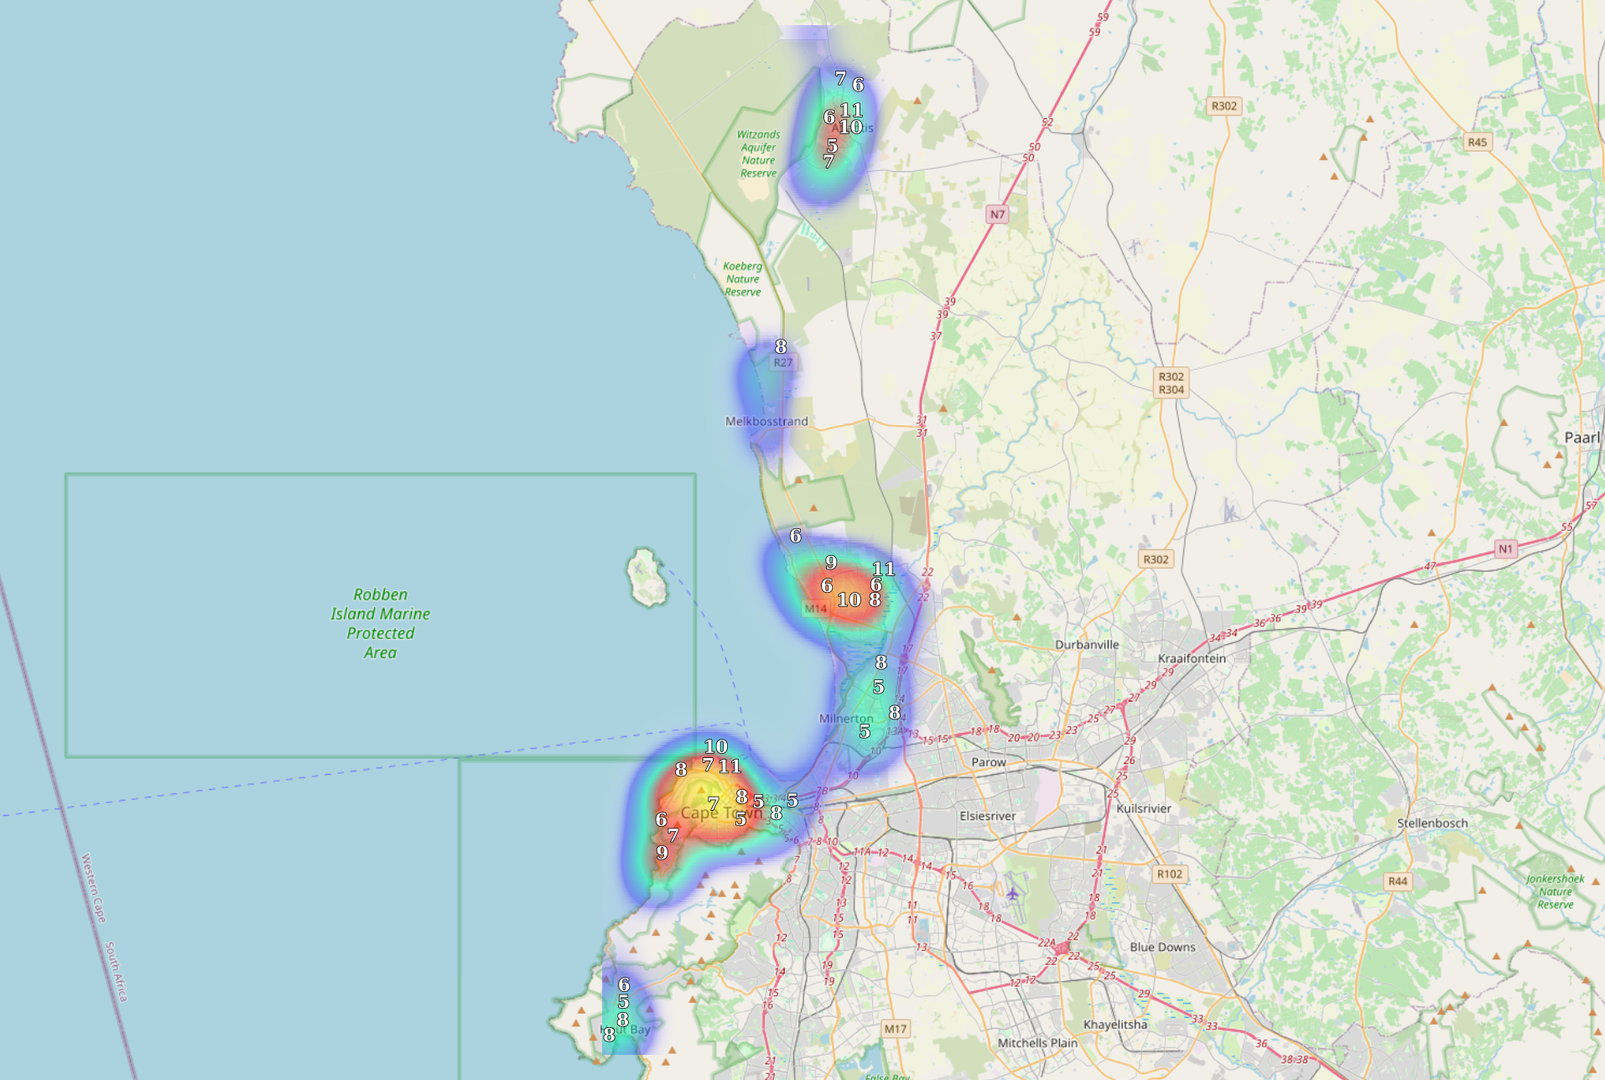
The style is functional and has been approved by the client. However, I would like to revisit the labelling logic to better align it with the heatmap styling. Specifically, I aim to have the labels correspond to the colour breaks in the heatmap rather than relying on a separate clustering logic.
-
sur Mappery: Wellington Botanic Garden
Publié: 16 January 2025, 12:00pm CET
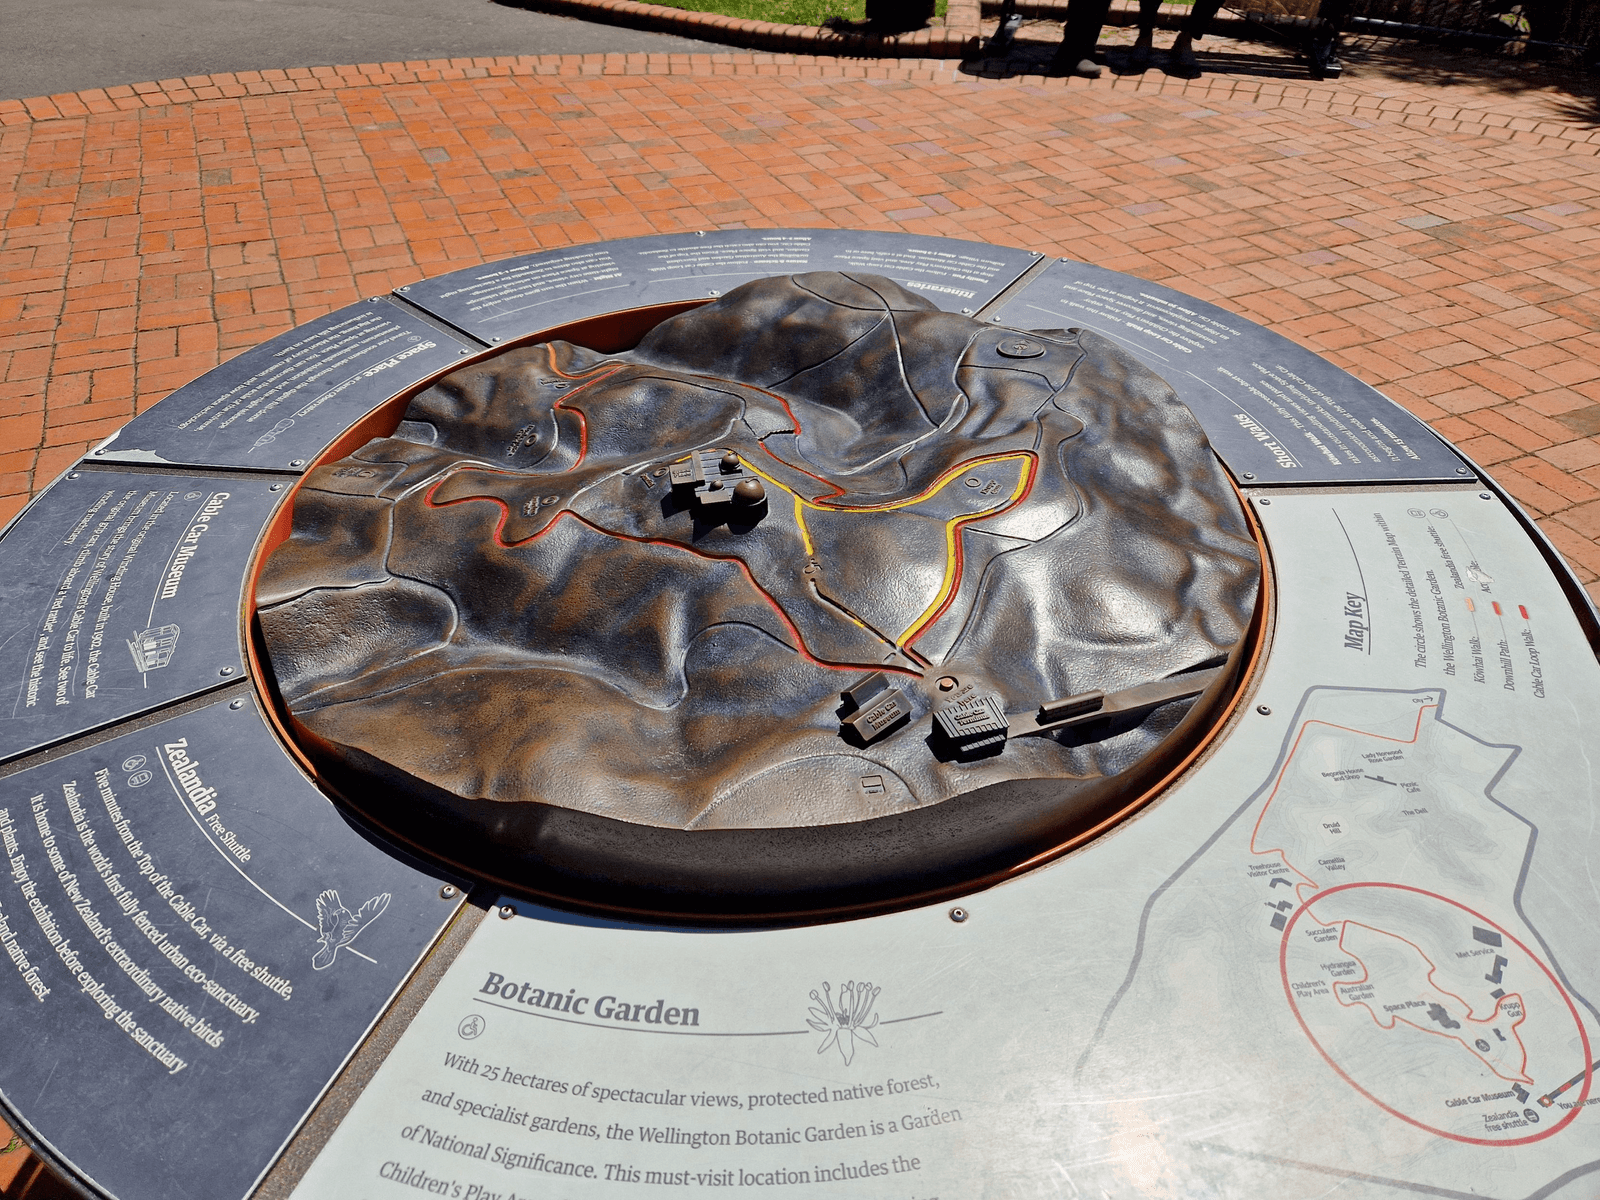

Cartodataviz shared this 3d topographic map of a part of the botanic garden in Wellington
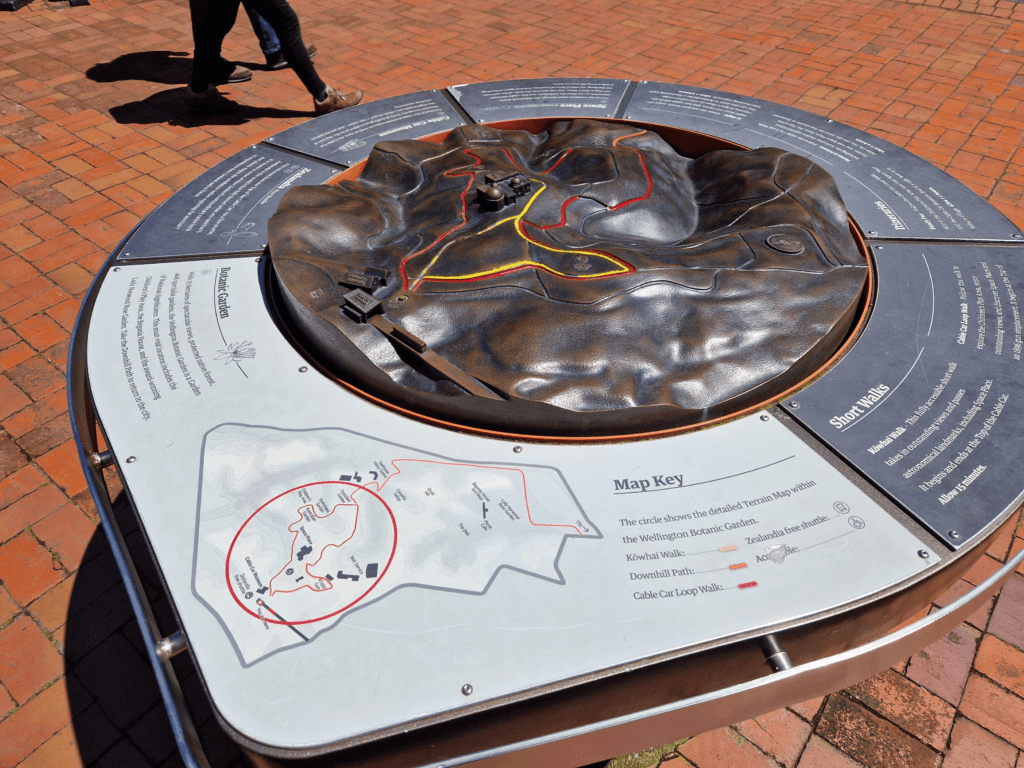
-
sur Jackie Ng: Announcing: mapguide-react-layout 0.14.10 and MapGuide Maestro 6.0m13
Publié: 15 January 2025, 4:21pm CET
We start the new year with a double-header release of:
- MapGuide Maestro 6.0m13
- mapguide-react-layout 0.14.10
Namely, it is to do with a notification I received about the coming deprecation (and eventual shutdown) of the epsg.io service that both pieces of software use to do proj4 projection lookups for any given EPSG code. This service will shutdown in Feburary (next month) and transition over to the MapTiler coordinates API. This new API requires an API key to use their services.
In the context of these 2 projects, the API key requirement introduces too much friction.- If I take up the offer to use MapTiler, I have to register and bake my API key into both Maestro and mapguide-react-layout and am now responsible for API usage/monitoring under this key from users I have no control over. Last thing I want to deal with is bug reports from users because, let's say for example: proj4 lookup is broken because the API is no longer accessible for my API key due to quota exceeded. I just don't want to deal with such a scenario.
- Which means the alternative is to change the code to the extent that users can "bring their own API key", taking such API key usage/monitoring concerns out of my hands. This too is also too much hassle. I just want to do EPSG code to proj4 lookups nothing more nothing less!
So in light of these concerns, instead of moving to MapTiler coordinates. Instead I have opted to use spatialreference.org to do EPSG -> proj4 lookups. No API keys are required there.
So since this was the main driver for needing to put out new releases of MapGuide Maestro and mapguide-react-layout, we might as well take this opportunity to lump in some other fixes and minor changes, which are detailed below.mapguide-react-layout changes(reworked) Stamen and (new) StadiaMaps supportStamen tiled layer support was broken for some time since it was taken over by Stadia Maps. I had already taken care of this in the VSCode map preview extension which had the same problem. But for mapguide-react-layout, the fix was a bit different due to it not using the latest version of OpenLayers and it is too much work right now to update to the latest OpenLayers in mapguide-react-layout.
So what was done for mapguide-react-layout instead is to create these Stamen tile layers as XYZ layers instead of using the (now broken for that OL release) Stamen tile source. This works because Stamen tiles are ultimately tilesets using the XYZ web mercator scheme. The only other changes is that a Stadia Maps API key is required. So if your appdef defines one or more Stamen tile layers and you didn't specify an API key, you'll get the same startup warning you get when you have Bing Maps layers and didn't specify a Bing Maps API key
But if you do provide a Stadia Maps API key, you'll get the Stamen layers you've seen before.
Since a Stadia Maps API key is now required, we've also added support for other tilesets provided by Stadia Maps, like:
Alidade Smooth
Alidade Smooth Dark
Alidade Satellite
Outdoors
So if you are loading your mapguide-react-layout viewer from a Flexible Layout document, where do you need to specify this new Stadia Maps API key?
That's where the new release of MapGuide Maestro comes in to help!MapGuide Maestro ChangesStamen Maps (changed) and Stadia Maps (new) supportThe Fusion Editor has reworked Stamen Maps support and added support for Stadia Maps
You'll notice that Stamen and Stadia Maps have 2 variants for every layer.- A specialized version
- An XYZ layer variant ("... as XYZ")
This was done so that if you are still authoring Flexible Layouts for Fusion instead of mapguide-react-layout, you can still view Stamen and Stadia Maps layers in Fusion through the existing XYZ layer support that is available in Fusion as demonstrated in the screenshot below, using the Stadia Maps alidade_smooth_dark tileset + API key.
So depending on the context:
If you are authoring a Flexible Layout for Fusion, choose the "... as XYZ" version and enter the Stadia Maps API key when prompted.
Otherwise, if you are authoring a Flexible Layout for mapguide-react-layout, choose the specialized version and enter the Stadia Maps API key in the provided field
This release of mapguide-react-layout will read the Stadia Maps API key from this new setting in the Flexible Layout when initializing with Stamen and Stadia Maps tile layers.
Using spatialreference.org for EPSG > proj4 lookupsAs stated above, the projection management dialog of the Fusion Editor now uses spatialreference.org for resolving proj4 strings from EPSG codes
Other changes- WMS Feature Source Editor: Improved the responsiveness and usability of the Advanced Configuration Dialog
- You can finally copy (ctrl-c) content in the IronPython console!!! You can now truly iterate on automation scripts by finally being able to copy the snippets of working Python code you just entered and eval-ed.
-
sur GeoSolutions: GeoSolutions at GeoWeek Feb 10-12 (Booth 1543): Cesium/3D Tiles Support in MapStore
Publié: 15 January 2025, 1:24pm CET
You must be logged into the site to view this content.
-
sur Mappery: Dona Lina
Publié: 15 January 2025, 12:00pm CET


Erik spotted this on his vacation in Seville
-
sur Mappery: Rail Post Office Network
Publié: 14 January 2025, 12:00pm CET


Oliver Leroy said “Doing some trains nerd tourism, very hard to imagine how big the industry was before and how fast the change happened #mapsinthewild“
I couldn’t resist some nerdy research and found this
-
sur OPENGIS.ch: Visualizing Ideas: From circles to planets to story arcs
Publié: 14 January 2025, 7:00am CET
My first day at OPENGIS.ch back in September wasn’t what you usually expect when starting at a new workplace. Instead of diving head first into some complex code repository or reading up on company policies, I found myself scribbling lines and circles onto paper.
The OPENGIS.ch team was meeting in Bern at Puzzle ITC / We Are Cube for a workshop on visualizing ideas, hosted by Mayra and Jürgen from We Are Cube. For a few hours, a room full of slightly unsure, but mostly intrigued geo ninjas armed with pencils and paper discovered a new way to express their ideas through simple visuals.
Getting Started: Persuading the «I-Can’t-Draw-For-My-Life» Crowd
Entering the meeting room, some felt slightly threatened by the pencils on the table, but we were quickly assured that no one was expected to become the next Picasso – just to visualize ideas. Easy, right?
Visualizations help us understand, remember, and process ideas better than text or numbers can. Our brains are wired to process images far quicker than text. Being able to sketch ideas is a great skill, so let’s do it!
But for some of us, artistic expression is limited to drawing UML diagrams, and even that can be outsourced to code (see this nifty little tool called Mermaid). So, when it came time to draw our favorite animals as a warm-up, some people were a bit out of their comfort zone. But we soon learned that there are many neat tricks and strategies to make visualizing ideas easier.
The Basics: Shapes, Containers, Arrows, ExpressionsAfter getting over the stress of drawing animals, it was time to get into the basics. Jürgen explained that everything can be visualized using just a handful of simple shapes: circles, squares, triangles, and lines.
By adding a few details to these shapes, we can visualize many different objects without getting lost in the complexity of reality. And suddenly, a circle can be a hole in the paper, a plate or planet earth.
To then visualize even more complex ideas, only three basic elements are needed – containers (like rectangles or circles), arrows, and facial expressions. Containers represent the things we care about (whether that’s a person, an object, or an idea). Arrows help us show the relationships or flow between them. And facial expressions, well, they capture emotion.
By using these basic elements we build complex ideas – no high-level artistic skill required!
The Story Arc: Put your idea into a storyNow that we were a bit more comfortable with expressing ourselves on paper, we were introduced to the Story Arc. It’s a framework that helps structure a narrative visually. Whether you’re presenting a project, brainstorming a new product, or explaining a complex process, having a clear story structure makes everything easier to understand and remember.
So the last task of the day was to invent a story and visualize it. With nothing more than some simple circles, squiggly lines and lots of imagination, we were able to convey our stories with ease. The results were some catchy tales about empty phone batteries, juggling demanding job tasks or flying to the moon to solve a customer problem.
Conclusion: The power of visualizing Ideas
Turns out, visualizing ideas isn’t just for artists! Whether it’s brainstorming a new product or explaining a complex concept, simple visual tools can make ideas clearer and more memorable.
So, the next time you’re staring at a blank whiteboard or trying to figure out the best way to pitch an idea, just remember: grab a pencil, draw a circle, and let your imagination go wild.
Thanks, Mayra and Jürgen from We Are Cube – you’ve taught us that even non-artists can visualize ideas, and it’s all just a handful of simple shapes away!
-
sur Camptocamp: Odoo Store Locator Module: Supporting Local Collaboration with Open Source Innovation
Publié: 14 January 2025, 2:00am CET
Pièce jointe: [télécharger]
When Onestein, an Odoo partner based in Breda, Netherlands, approached Camptocamp, they had a unique request: to create a store location module for the Odoo ERP system, complete with an interactive map. -
sur QGIS Blog: Plugin Update – December, 2024
Publié: 13 January 2025, 7:56pm CET
In December, there were 37 new plugins published in the QGIS plugin repository.
Here follows the quick overview in reverse chronological order. If any of the names or short descriptions catches your attention, you can find the direct link to the plugin page in the table below:
Filtra Selecionados | Filter Selected Filtra a camada ativa com base nas feições selecionadas, considerando a estrutura e os tipos de campos para uma filtragem otimizada. | Filters the active layer based on selected features, considering the structure and field types for optimized filtering. French Point Elevation Récupère l’altitude à partir du RGE ALTI® (IGN, FRANCE). RAVI Remote Analysis of Vegetation Indices. MGBInputTool This plugin prepares the data for the MGB-IPH model. Integrator us?ug danych przestrzennych Narz?dzie stworzone dla u?ytkowników QGIS, które umo?liwia szybki i bezpo?redni dost?p do danych przestrzennych pochodz?cych z oficjalnej ewidencji zbiorów i us?ug danych przestrzennych kraju (EZiUDP). To najlepszy sposób pracy z polskimi danymi przestrzennymi, je?li na co dzie? z nich korzystasz. Basemaps A QGIS plugin to load multiple online basemap services. Hypsometric Curve Calcola la curva ipsometrica di un bacino idrografico partendo da un layer DEM e da un layer vettoriale contenente il poligono che delimita il bacino stesso. Puoi assegnare la banda di colore per la definizione delle quote altimetriche del terreno, inserire il numero per suddividere l’area del bacino delimitato dal poligono, per la definizione degli intervalli delle quote altimetriche. *** English: Calculate the hypsometric curve of a hydrographic basin starting from a DEM layer and a vector layer containing the polygon that delimits the basin itself. You can assign the color band to define the elevations of the terrain, enter the number to divide the area of ??the basin delimited by the polygon, to define the intervals of the elevations. Mapa Glebowo-Rolnicza Wtyczka do wizualizacji mapy glebowo rolniczej. Geosimulation Land Changes This plugin is a tool used in spatial modeling to predict changes in land cover or land use. CityForge CityForge is a QGIS plugin for reconstructing 3D buildings from footprint and point cloud into CityJSON files. qgis_otp_multi_isochrone_plugin Make Isochrone with OpenTripPlanner Ver1.5. HVLSP merge packages This plugin merges high-value large-scale Geopackage files provided by the Open maps for Europe 2 (OME2) project. sz_processing Susceptibility Zoning plugin. Osm Map Matching Plugin aligning route points with OpenStreetMap roads, including OSM fields. Accessibility calculator Accessibility Calculations. APNCad Applicatif destiné à la prise de notes sur tablette numérique lors des opérations de terrain réalisées pendant le remaniement cadastral. APNCad est le fruit de la collaboration entre Jean-Noël MARCHAL de la BNIC de Nancy et Marius FRANÇOIS-MARCHAL. QuODK A link between ODK Central data and QGIS. EODH Workflows Access and run workflows on the EODH. Next Print This plugin makes it easy to print using templates and text. DataAW DataAW compares two files using area-weighted data. WIMS Integrate Aggregates WIMS field data with Web Services. Wurman Dots Create Wurman Dots using a square or hexagonal grid. qgis_color_ramp_generator Generate QGIS color ramp XML files. variablePanel Displays project variables in a dedicated panel. Siligites Plugin pour l’étude de la proximité entre des sites archéologiques et les formations géologiques à silicites qui leur sont liées. Q4TS QGIS for TELEMAC-SALOME is a pre-processing of open-TELEMAC meshes: mesh creation, mesh modification, mesh interpolation, creation of boundary condition file. Dissect and dissolve overlaps (SAGA NextGen) Detect, zoom to, dissect and dissolve overlaps in one polygon layer. TiffSlider This plugin lets you switch effortlessly between .tiff-layers in your chosen group via horizontal slider. It was mainly scripted to visualize GPR radargrams to depict the change of ground structure. Offset Lines This plugin lets you offset lines parallel to its original in a variable distance. Quick BDL Pobieranie obiektów GUS/BDL (EN: Downloading objects from the Central Statistical Office of Poland / Local Data Bank). RoutesComposer Composer of roads from network of segments. GeoParquet Downloader (Overture, Source & Custom Cloud) This plugin connects to cloud-based GeoParquet data and downloads the portion in the current viewport. Prettier Maps Style your QGIS maps. OpenDRIVE Map Viewer This plugin adds support to visualize OpenDRIVE maps to QGIS. geo_easyprint ????????? Territory Analysis This is an example of a plugin for creating an automated report on a comprehensive analysis of the territory using remote sensing data. Surface Water Storage This plugin generates the inundation area and elevation-area-volume graph for an area. -
sur Mappery: Curiositi
Publié: 13 January 2025, 12:00pm CET


Raf spotted this shop sign in Pamplona
-
sur Nick Bearman: FOSS4G 2024 - Belém, Brazil
Publié: 13 January 2025, 2:00am CET
I was very lucky to be able to attend FOSS4G 2024, in Belém, Brazil on 2nd - 8th December 2024. Belém is a fantastic city, and due to host COP30 in November 2025, with lots of construction on going. FOSS4G has a wonderful community and a great variety of talks - have a look at the agenda to see the different topics under discussion.
Tri-lingual welcome, in Portugese, Spanish and English at FOSS4G 2024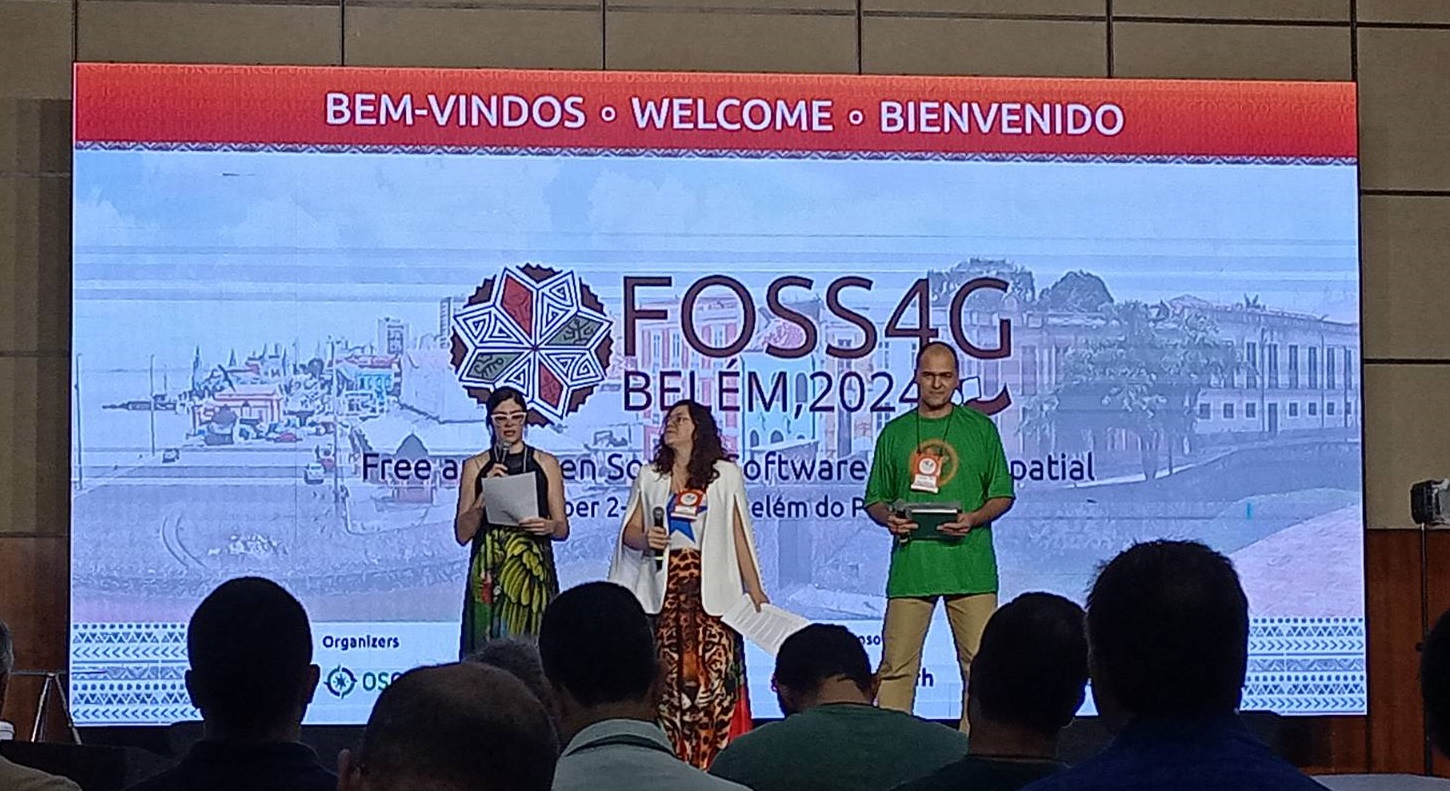
The first two days were workshops, and I attended XYZ Cloud MAPPing 101 presented by Dennis Bauszus, and Community Drone Mapping by Ivan Buendi?a Gayton. In some ways I find the workshops the most useful element of the conference because it gives you time to dig in to a specific piece of software and learn some new skills, something I am quite poor at doing during my usual ‘day job’! I learnt some new useful skills in both workshops. Dennis has also shared the XYZ Mapping workshop materials if you have more discipline than me(!) and can work through it on your own:
- More details on the app itself
- Start with Getting started
- Then look at the workshop
The Drone workshop was also fascinating, and Ivan did a great job of both teaching us how to fly a drone (easier than I thought) and how to help local communities leverage the power of drones (& wider GIS skills) for their own benefit.
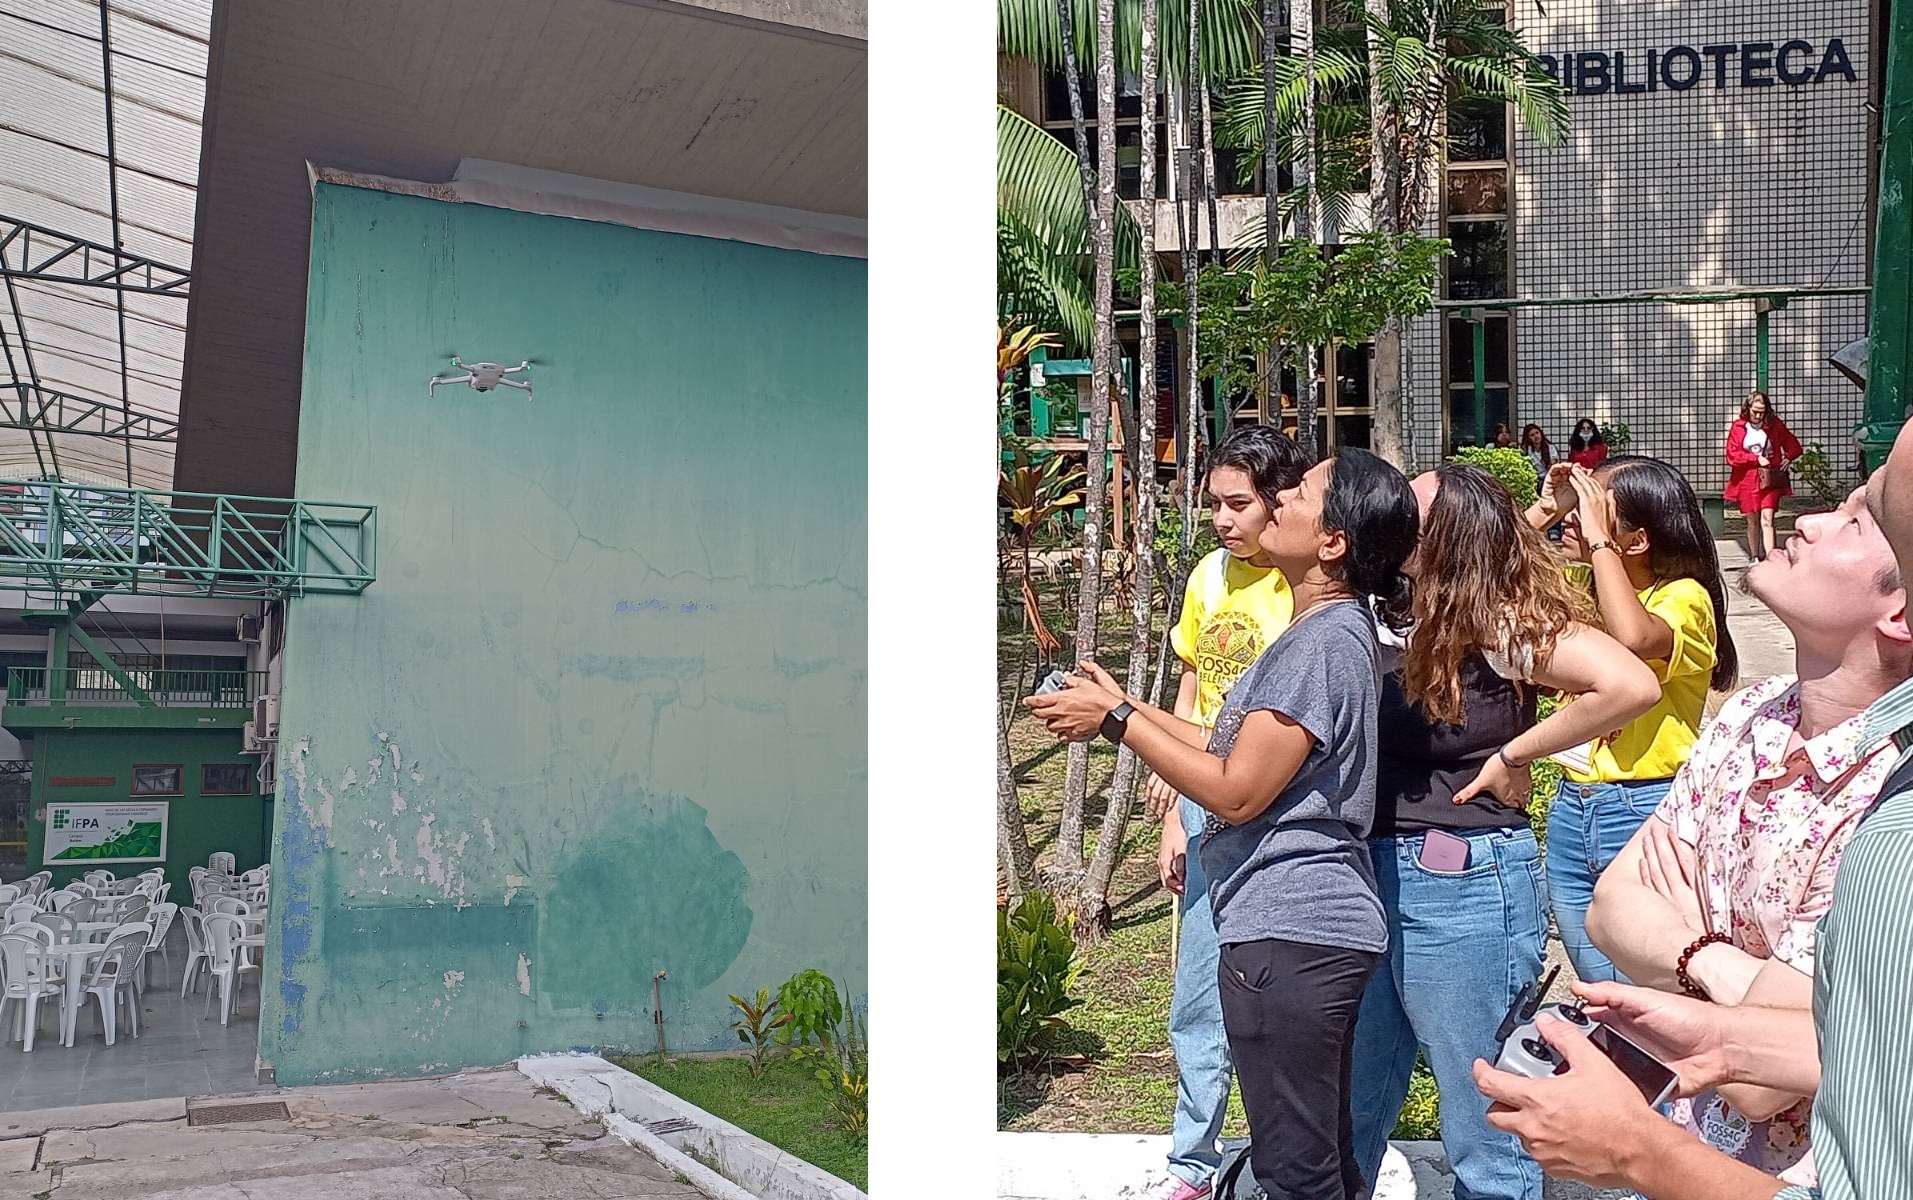
The main conference itself was in the Hanger Convention Centre and it was a great international conference. The laid back approach of FOSS4G always creates a lovely atmosphere and it was a great opportunity to get to know new people in the FOSS4G world, and catch up with people I have met at previous events. Community is one of the key things that I love about this group, with people very willing to help each other out. Uber is a key method of transportation in Brazil, and with a number of the evening social events in the city centre, we usually clubbed together at the hotel reception for an Uber to get us there, and back afterwards!
The variety of talks was incredible, with fascinating applications of FOSS4G tools, discussions on the interaction of academia and FOSS4G and personal reflections on people’s FOSS4G journeys. I particularly Kim Durante’s talk on FAIR Principles for Geospatial Data Curation which might have some very useful ideas for a project I am working on at the moment, and Veronica Andreo’s talk, From field biology to the GRASS GIS board - an open source journey about how she got involved in the GRASS GIS project.
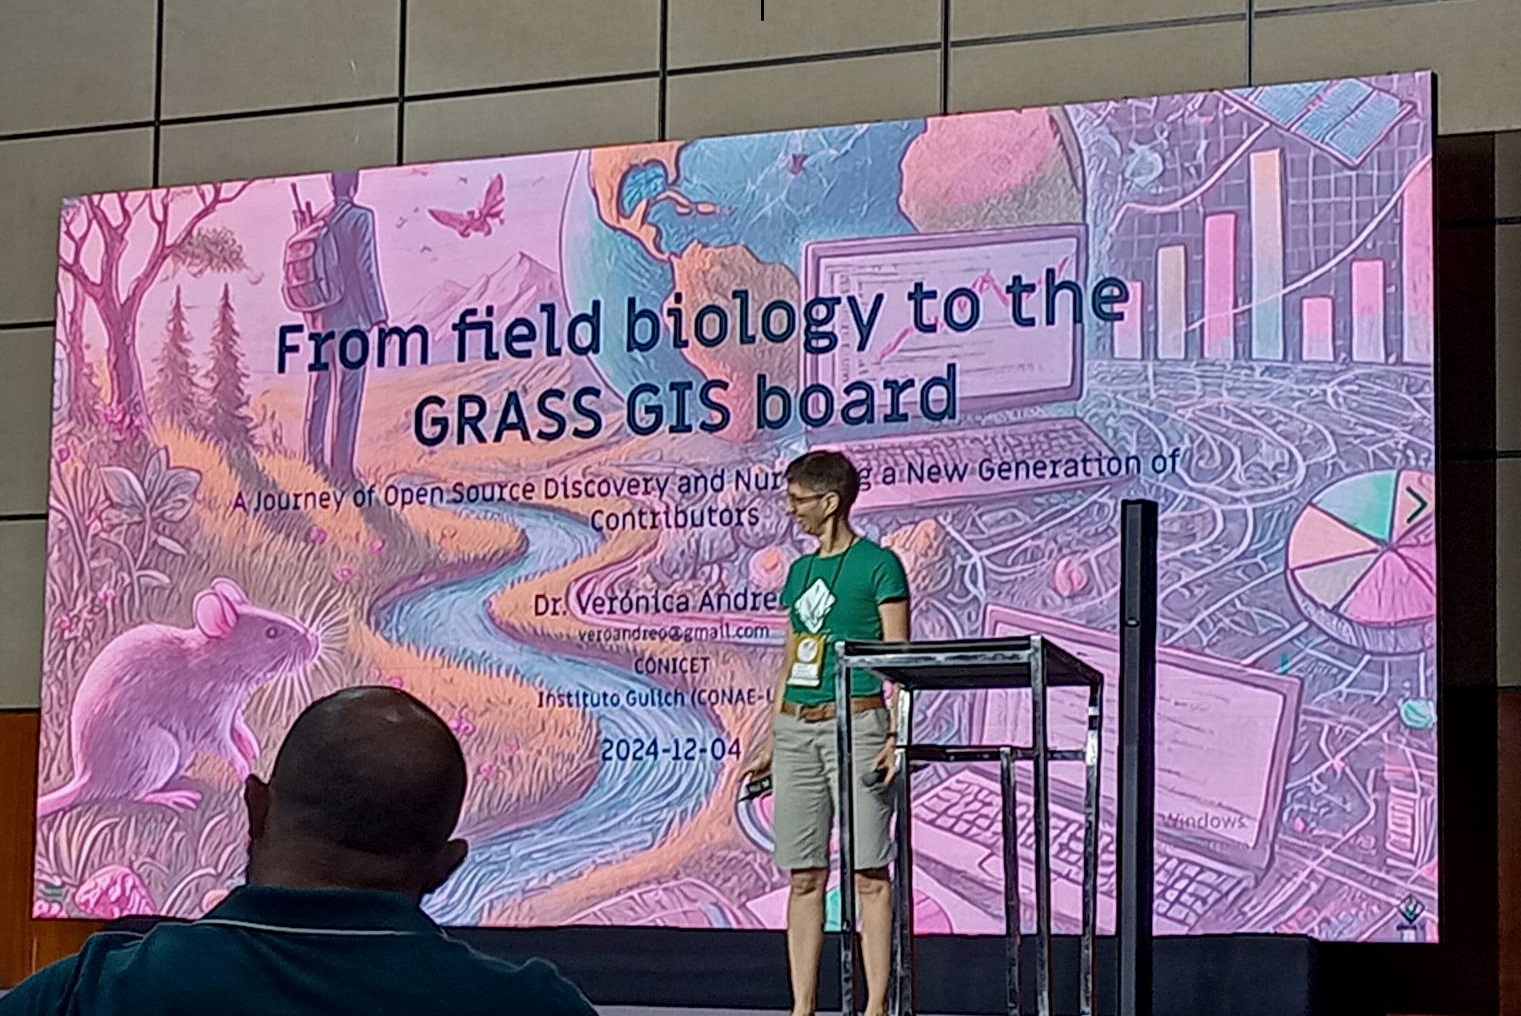
I met one lady from Brazil and this was her first international, English speaking conference. She was really enjoying herself and it was a great introduction to the FOSS4G community for her.
One thing that came across to me was the variety of open source projects, and how some projects seem to be doing very similar things. Two examples that come to mind are QField and Mergin Maps, both of which allow users to collect data in a QGIS project in the field on their phone, and process that data back in the office. Another pair would be QGIS and GRASS GIS, both arguably great quality Desktop GIS tools, and there are many other examples too.
Initially I wondered why there were so many similar tools like this, when it might make more sense to combine effort and focus on one tool, rather than splitting our effort over two? However after a bit of reflection I discovered a) that often two similar tools have differences that make them more useful to different audiences. For example, QField is a more flexible field data collection tool, and Mergin Maps is easier to get up and running with. Also, b) having multiple tools reflects the market approach of encouraging development and innovation, with the best tool ‘winning’. In this context winning is not by having the highest revenues or the highest profits, but by having communities of users and developers. If a project doesn’t have a good group of users and/or a good group of developers interested in keeping the project up to date, then gradually it will fall out of use. I was not expecting to see an example of a capitalist based market in the open source community, but here it is!
I also had the opportunity to met Katja Haferkorn, who is the coordinator for FOSSGIS e.V. FOSSGIS e.V. is the OSGeo Local Chapter for German-speaking countries - D-A-CH, i.e. Germany, Austria and the german speaking part of Switzerland. FOSSGIS e.V. is also the German local chapter for OpenStreetMap. FOSSGIS e.V. is quite unique in that they are a local chapter who has a paid coordinator - Katja - and it was fascinating to hear her experiences. As OSGeo:UK Chair, one of the questions I asked her was about diversity within Local Chapters, and OSGeo as a whole. This is an issue for them as well and it is a aspect of membership that has been challenging the whole community for a while. Katja has written a great blog post about the conference. It is in German, but Google Translate does a reasonable job of translating it into English.
Working at the Code Sprint, thanks to Felipe Barros for the photo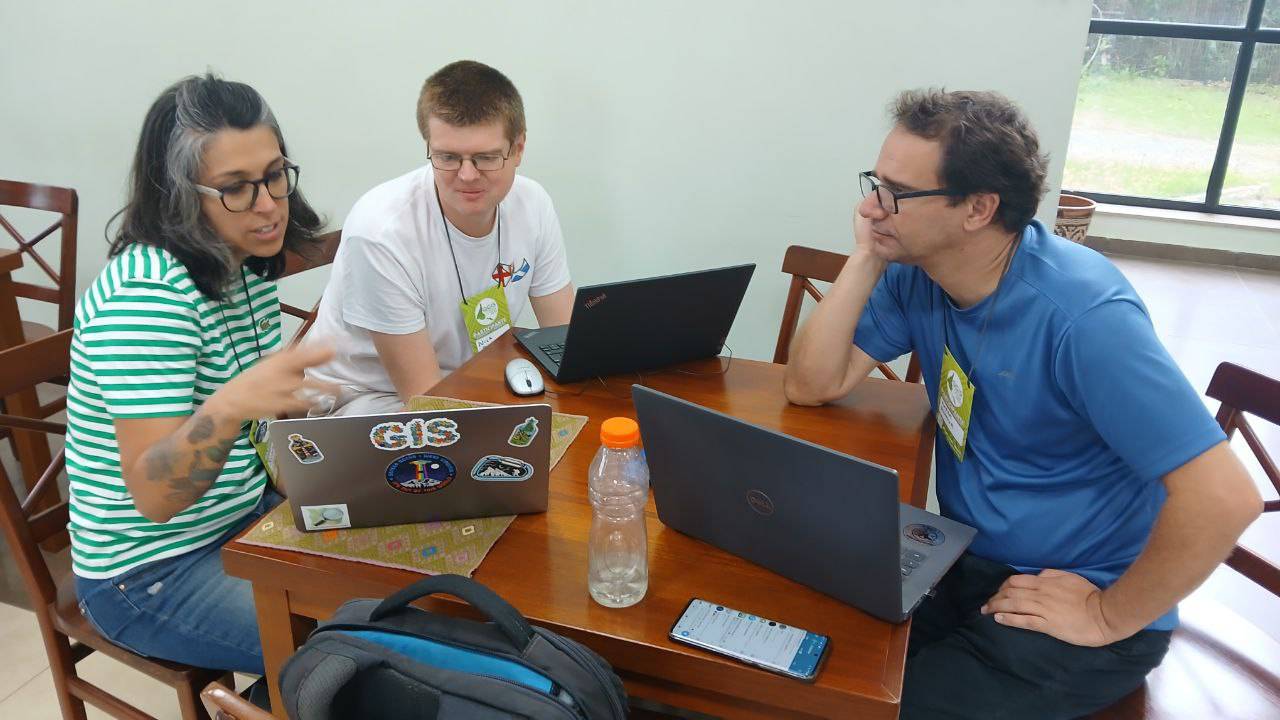
The last two days of the conference was the Code Sprint. This is a chance to meet people working on different open source GIS projects and learn how to contribute to different elements of the projects. I had a great chat with Silvina Meritano and Andrés Duhour about using R as a GIS. Silvina was keen to develop her mapping skills in R, and Andrés had already developed an R package (which he presented at the conference: osmlanduseR) and spent a bit of time learning about and contributing to the new
tmaplibrary examples.Tmapversion 4 is coming out (blog post coming soon!) and I needed to updated my material for this new version. I also spent some time looking at the Las Calles De Las Mujeres project, which looks at the proportion of streets named after women (rather than men) in a range of Spanish speaking countries. Silvina and I had a go at creating a version in R that could automate some more of the process to apply this to different cities in English speaking countries.The internet connection at the code sprint was a little variable, so we had some challenges and had to resort to using the “sneaker net” occasionally - using a USB stick to transfer data between us! Fortunately we never had to resort to playing truco - a card game played in Argentina when the internet doesn’t work and you have nothing else to do!
Conference group photo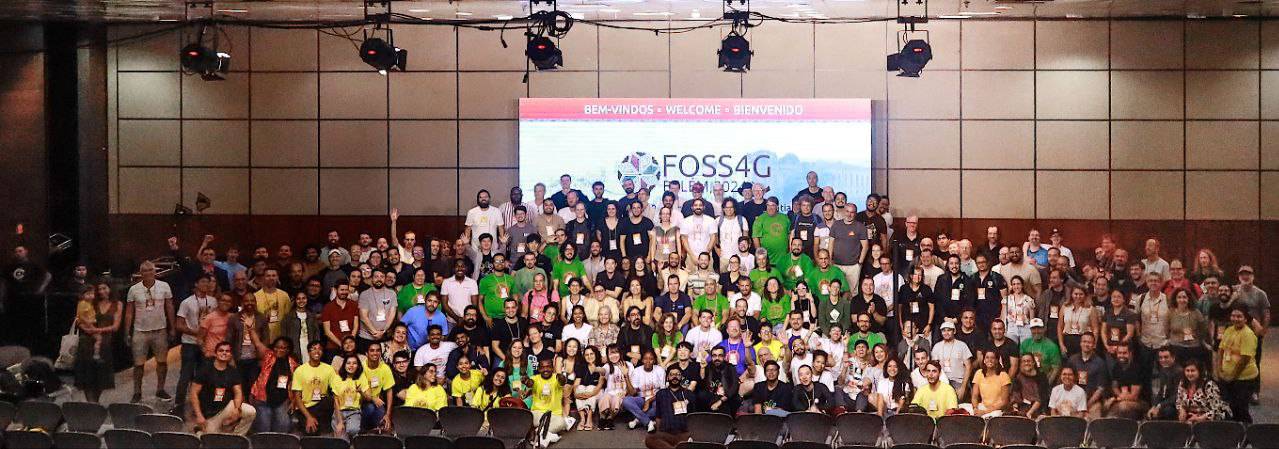
Thanks very much to everyone involved in organising the conference. Many more photos are on Flickr. The conference was a fantastic experience, and if you ever have the opportunity to go to a FOSS4G conference, anywhere, do take it!
If you want help or advice on any open source geospatial tool, or are interested in Introductory or Advanced GIS training in QGIS or R, please do contact me.
-
sur GeoServer Team: GeoServer 2025 Roadmap
Publié: 13 January 2025, 2:00am CET
Happy new year and welcome to 2025 from the GeoServer team!
Last year we started something different for our project - sharing our 2024 roadmap plans with our community and asking for resources (participation and funding) to accomplish some challenging goals. We would like to provide an update for 2025 and a few words on our experience in 2024.

The GeoServer project is supported and maintained thanks to the hard work of volunteers and the backing of public institutions and companies providing professional support.
GeoServer was started in 2001 by a non-profit technology incubator. Subsequent years has seen the project supported by larger companies with investors and venture capital. This support is no longer available - and without this cushion we must rely on our community to play a greater role in the success of the project.
We are seeking a healthy balance in 2025 and are asking for support in the following areas:
-
Maintenance: The GeoServer team uses extensive automation, quality assurance tools, and policy of dropping modules to “right size” the project to match developer resources.
However maintenance costs for software markedly increased in 2024 as did time devoted to security vulnerabilities. This causes the components used by GeoServer to be updated more frequently, and with greater urgency.
?? Community members can answer questions on geoserver-user forum, reproduce issues as they are reported, and verify fixes.
?? Developers are encouraged to get started by reviewing pull-requests to learn what is needed, and then move on to fixing issues.
-
Security Vulnerabilities: GeoServer works with an established a coordinated vulnerability disclosure policy, with clear guidelines for individuals to particpate based on trust, similar to how committers are managed. Our 2024 experience with CVE-2024-36401 highlights the importance of this activity for our community and service providers.
?? Trusted volunteers can help mind geoserver-security email list, and help reproduce vulnerabilities as they are reported. We also seek developer capacity and funding to address confirmed vulnerabilities.
-
Releases: Regular release and community testing is a key success factor for open source projects and is an important priority for GeoServer. Peter has done a great job updating the release instructions, and many of the tasks are automated, making this activity far easier for new volunteers.
?? Developers and Service Providers are asked to make time available to to assist with the release process.
Asking our community to test release candidates ahead of each major release has been discontinued due to lack of response. The GeoServer team operates with a time-boxed release model so it is predictable when testing will be expected.
?? Community members and Service Providers are asked to help test nightly builds ahead of major releases in March and April.
-
Testing: Testing of new functionality and technology updates is an important quality assurance activity We have had some success asking downstream projects directly to test when facing technical-challenges in 2023.
?? We anticipate extensive testing will be required for GeoServer 3 and ask everyone to plan some time to test out nightly builds with your own data and infrastructure during the course of this activity.
-
Sponsorship: In 2023 we made a deliberate effort to “get over being shy” and ask for financial support, setting up a sponsorship page, and listing sponsors on our home page.
The response has not been in keeping with the operational costs of our project and we seek ideas on input on an appropriate approach.
?? We ask for your financial assistance in 2025 (see bottom of page for recommendations).
The above priorities of maintenance, testing and sponsorship represent the normal operations of an open-source project. This post is provided as a reminder, and a call to action for our community.
2025 Roadmap Planning CITE CertificationOur CITE Certification was lost some years ago, due to vandalism of a build server, and we would like to see certification restored.
OGC CITE Certification is important for two reasons:
- Provides a source of black-box testing ensuring that each GeoServer release behaves as intended.
- Provides a logo and visibility for the project helping to promote the use of open standards.
Recent progress on this activity:
- As part of a Camptocamp organized OGCAPI - Features sprint Gabriel was able setup a GitHub workflow restoring the use of CITE testing for black-box testing of GeoServer. Gabriel focused on OGC API - Features certification but found WMS 1.1 and WCS 1.1 tests would also pass out of the box, providing a setup for running the tests in each new pull request.
- Andrea made further progress certifying the output produced by GeoServer, restoring the WMS 1.3, WFS 1.0 and WFS 1.1 tests, as well as upgrading the test engine to the latest production release. In addition, CITE tests that weren’t run in the past have been added, like WFS 2.0 and GeoTIFF, while other new tests are in progress, like WCS 2.0, WMTS 1.0 and GeoPackage.
- The Open Source Geospatial Foundation provides hosting for OSGeo Projects. Peter is looking into this opportunity which would allow the project to be certified and once again be a reference implementation.
?? Please reach out on the developer forum and ask how you can help support this activity.
GeoServer 3GeoServer 3 is being developed to address crucial challenges and ensure that GeoServer remains a reliable and secure platform for the future.
Staying up-to-date with the latest technology is no longer optional — it’s essential. Starting with spring-framework-6, each update requiring several others to occur at the same time.

Our community is responding to this challenge but needs your support to be successful:
-
Brad and David have made considerable progress on Wicket UI updates over the course of 2024, and with Steve’s effort on Content Security Policy compliance (CSP headers are enabled by default in newer versions of Wicket).
-
Andreas Watermeyer (ITS Digital Solutions) has been steadily working on Spring Security 5.8 update and corresponding OAuth2 Secuirty Module replacements.
-
Consortium of Camptocamp, GeoSolutions and GeoCat have responded to our roadmap challenge with a bold GeoServer 3 Crowdfunding. The crowd funding is presently in phase one collecting pledges, when goal is reached phase two will collect funds and start development.
Check out the crowdfunding page for details, faq, including overview of project plan.

?? Pledge support for GeoServer 3 Crowdfunding using email or form.
?? Developers please reach out on the developer forum if you have capacity to work on this activity.
?? Testers GeoServer 3 will need testing with your data and environment over the course of development.
Service ProvidersService providers bring GeoServer technology to a wider audience. We recognize core-contributors who take on an ongoing responsibility for the GeoServer project on our home page, along with a listing of commercial support on our website. We encourage service providers offering GeoServer support to be added to this list.
Helping meet project roadmap planning goals and objectives is a good way for service providers to gain experience with the project and represent their customers in our community. We recognize service providers that contribute to the sustainability of GeoServer as experienced providers.
?? We encourage service providers to directly take project maintenance and testing activities, and financially support the project if they do not have capacity to participate directly.
Sponsorship OpportunitiesThe GeoServer Project Steering Committee uses your financial support to fund maintenance activities, code sprints, and research and development that is beyond the reach of an individual contributor.
GeoServer recognizes your financial support on our home page, sponsorship page and in release notes and presentations. GeoServer is part of the Open Source Geospatial Foundation and your financial support of the project is reflected on the OSGeo sponsorship page.
Recommendations:
- Individuals can use Donate via GitHub Sponsors to have their repository badged as supporting OSGeo.
- Individuals who offer GeoServer services should consider $50 USD a month to be listed as a bronze Sponsor on the OSGeo website.
- Organisations using GeoServer are encouraged to sponsor $50 USD a month to be listed as a bronze sponsor on the OSGeo website.
- Organisations that offer GeoServer services should consider $250 a month to be listed as a silver sponsor on the OSGeo website.
?? For instructions on sponsorship see how to Sponsor via Open Source Geospatial Foundation.
Further reading:
Thanks to 2025 Sponsors:


-
-
sur Mappery: Candles and Globes
Publié: 12 January 2025, 12:00pm CET


Raf shared this pic. ’Candles shelf decorated with globes at Les Topettes perfume shop in Barcelona Raval’
-
sur Free and Open Source GIS Ramblings: Trajectools 2.4 release
Publié: 11 January 2025, 10:04pm CET

In this new release, you will find new algorithms, default output styles, and other usability improvements, in particular for working with public transport schedules in GTFS format, including:
- Added GTFS algorithms for extracting stops, fixes #43
- Added default output styles for GTFS stops and segments c600060
- Added Trajectory splitting at field value changes 286fdbd
- Added option to add selected fields to output trajectories layer, fixes #53
- Improved UI of the split by observation gap algorithm, fixes #36

Note: To use this new version of Trajectools, please upgrade your installation of MovingPandas to >= 0.21.2, e.g. using
i
mport pip; pip.main(['install', '--upgrade', 'movingpandas'])or
conda install movingpandas==0.21.2
-
sur Le blog de Geomatys: 2024 chez Geomatys
Publié: 23 December 2024, 12:23pm CET
 2024 chez Geomatys
- 23/12/2024
- Jordan Serviere
Alors que 2024 s’achève, Geomatys se distingue une fois de plus comme un acteur clé dans le domaine de l’information géospatiale, des systèmes d’information environnementale et de la défense. Cette année a été marquée par des avancées technologiques concrètes, des reconnaissances importantes et des collaborations stratégiques qui ont renforcé notre position dans des secteurs en constante évolution. Retour sur ces douze mois faits de projets ambitieux et de réalisations collectives.
Examind C2 : réinvention de la gestion tactiqueLe lancement d’Examind C2 représente une étape cruciale en 2024, tant pour Geomatys que pour les secteurs de la défense, de la cybersécurité et de la gestion de crise. Cette plateforme de Commande et Contrôle (C2), conçue pour répondre aux besoins complexes des environnements multi-milieux et multi-champs, se distingue par son interopérabilité avancée et son traitement en quasi-temps réel. Les visualisations dynamiques qu’elle propose offrent une supériorité informationnelle essentielle pour optimiser les prises de décision dans des situations critiques. Avec des capacités étendues en traitement de données spatiales, Examind C2 anticipe également les attentes futures des utilisateurs. Pour une analyse approfondie de ses capacités et de ses cas d’utilisation, rendez-vous sur le site officiel.
AQUALIT : vers une gestion durable de l’eau potableEn 2024, Geomatys a franchi une nouvelle étape avec la commercialisation d’AQUALIT, une plateforme novatrice destinée à l’analyse des mesures d’eau. Conçue spécifiquement pour les producteurs d’eau potable, AQUALIT leur fournit des outils puissants pour surveiller, analyser et optimiser la qualité de leurs ressources. Cette solution intègre des fonctionnalités avancées en gestion des données hydrologiques, en analyse prédictive et en visualisation cartographique. Dans un contexte où la gestion durable de l’eau est devenue un enjeu prioritaire, AQUALIT illustre parfaitement l’engagement de Geomatys en faveur de l’environnement et de l’innovation. Pour en savoir plus et découvrir toutes ses fonctionnalités, consultez le site d’AQUALIT.
OPAT devient ShoreInt : une évolution pour mieux répondre aux besoins côtiersEn 2024, notre projet OPAT a connu une évolution majeure en devenant ShoreInt. Cette transition reflète notre désir d’offrir une solution toujours plus adaptée aux enjeux complexes de la gestion des zones côtières. ShoreInt intègre des données issues de technologies comme l’AIS, les images satellites et la modélisation spatiale pour fournir une analyse précise des activités maritimes et des dynamiques environnementales. Avec une interface ergonomique et des outils avancés de visualisation, ShoreInt est conçu pour aider les décisionnaires à gérer les interactions complexes entre les activités humaines et les écosystèmes côtiers. Pour en savoir plus sur cette solution innovante, consultez le site de ShoreInt.
Lauréat du Concours d’innovation avec EpiwiseUn des temps forts de 2024 est sans conteste la distinction obtenue par Geomatys pour son projet Epiwise lors des Concours d’innovation de l’État. Soutenu par France 2030, ce projet épidémiologique figure parmi les 177 initiatives lauréates reconnues pour leur potentiel à transformer durablement leur secteur. Cette récompense reflète notre capacité à innover tout en répondant à des besoins sociétaux majeurs, tels que la prévention des pandémies et la modélisation épidémiologique. En s’appuyant sur des technologies de machine learning et de traitement des big data, Epiwise offre des perspectives nouvelles pour la santé publique.
Collaboration et continuité : une stratégie collectiveAu-delà de ces projets phares, Geomatys a maintenu en 2024 un rythme soutenu de collaboration dans des initiatives d’envergure. Parmi elles, FairEase, le portail Géosud et nos partenariats stratégiques avec Mercator Ocean et l’Office Français de la Biodiversité. Ces travaux, axés sur la valorisation des données spatiales, l’interopérabilité et la gestion des ressources naturelles, témoignent de notre engagement à développer des solutions ouvertes, accessibles et adaptées aux enjeux environnementaux contemporains. Ces projets, loin de s’arrêter en 2024, constituent un socle solide pour notre développement en 2025 et au-delà.
Et en 2025...Alors que nous nous tournons vers 2025, Geomatys se prépare à renforcer son impact et à ouvrir de nouvelles perspectives. En poursuivant nos investissements dans la recherche et le développement, notamment en télédétection, modélisation environnementale et gestion des données massives, nous ambitionnons de créer des solutions toujours plus performantes et adaptées aux besoins d’un monde en mutation rapide. L’année à venir sera marquée par le renforcement de nos relations avec nos partenaires stratégiques, dans une perspective de collaboration continue et durable. Nous adressons nos sincères remerciements à nos collaborateurs, dont l’engagement et les compétences sont le moteur de nos réussites, ainsi qu’à nos clients et partenaires pour leur soutien indéfectible. Ensemble, faisons de 2025 une année riche en projets et accomplissements. Toute l’équipe vous souhaite de très belles fêtes de fin d’année. Rendez-vous en 2025 !
Menu Linkedin
Twitter
Youtube
Linkedin
Twitter
Youtube

The post 2024 chez Geomatys first appeared on Geomatys.
-
sur PostGIS Development: PostGIS Patch Releases
Publié: 23 December 2024, 2:00am CET
-
sur Mappery: Candy Jar
Publié: 22 December 2024, 12:00pm CET

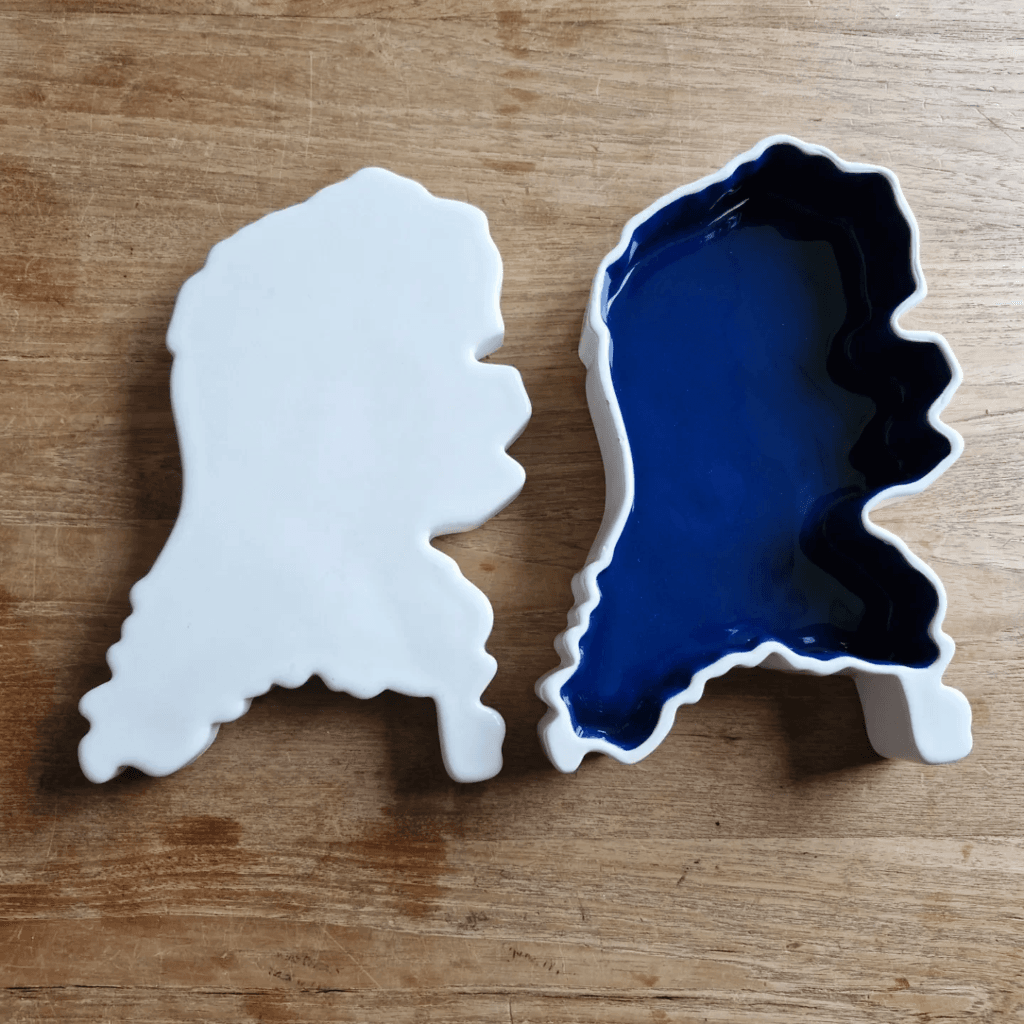
Koen Rutten shared this candy jar.
“#mapsInTheWild My new candy jar! Made by Royal Goedewaagen to the design of Sander Alblas. In my case: a second-hand one.”
-
sur Mappery: From the Heart
Publié: 21 December 2024, 12:00pm CET
Pièce jointe: [télécharger]
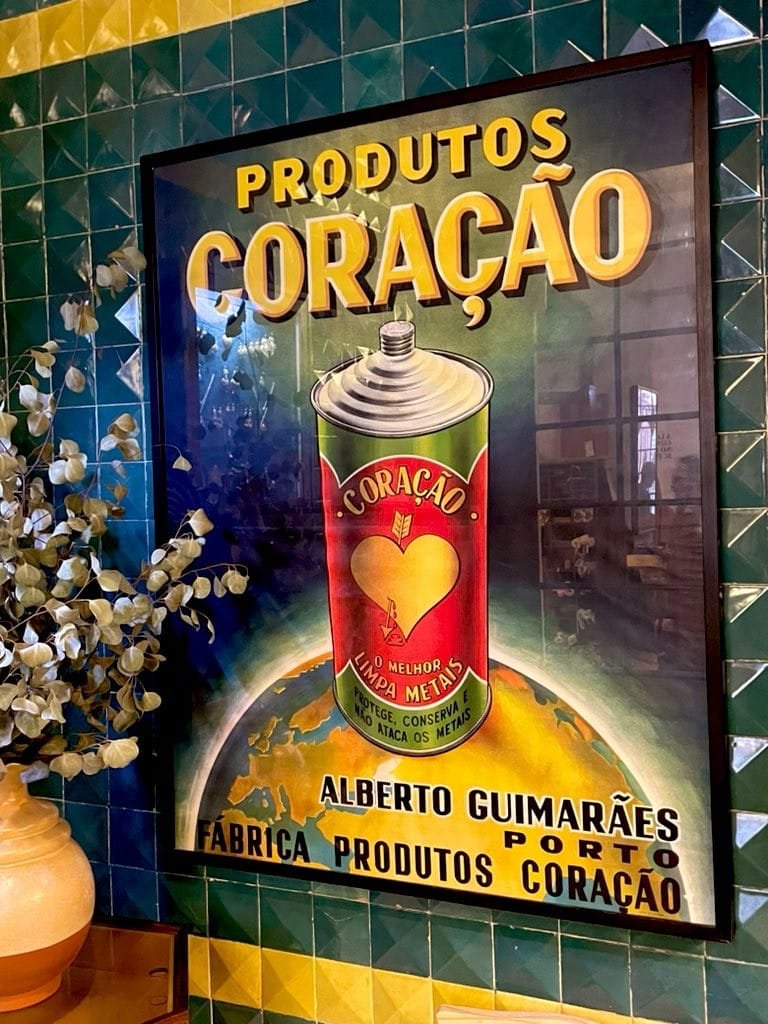
Another map shared by Le Cartographe during a trip to Portugal.
-
sur Mappery: How far have you flown from Tartu
Publié: 20 December 2024, 12:00pm CET


Ivan Sanchez Ortega spottted this big wall map in Tartu airport. People have placed coloured dots representing the furthest distance they have flown from Tartu. Not sure if the colours have added significance.
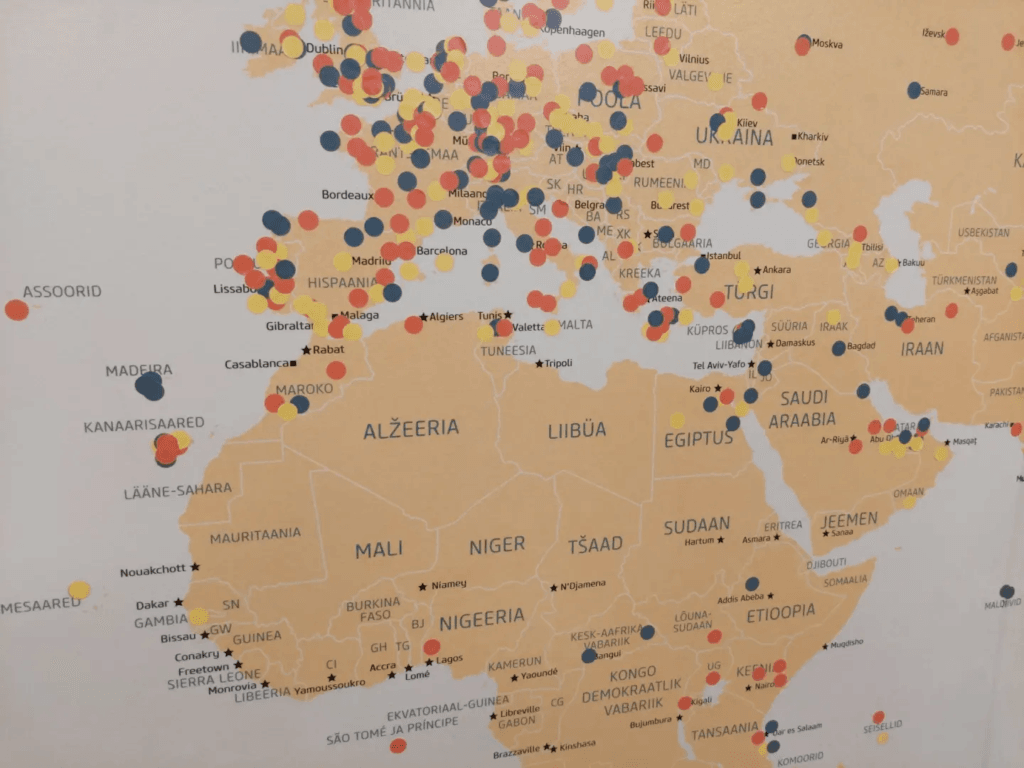
-
sur TorchGeo: v0.6.2
Publié: 20 December 2024, 1:22am CET
TorchGeo 0.6.2 Release NotesThis is a bugfix release. There are no new features or API changes with respect to the 0.6.1 release.
This release doubles the number of TorchGeo tutorials, making it easier than ever to learn TorchGeo! All tutorials have been reorganized as follows:
- Getting Started: background material on PyTorch, geospatial data, and TorchGeo
- Basic Usage: basic concepts and components of TorchGeo and how to use them
- Case Studies: end-to-end workflows for common remote sensing use cases
- Customization: customizing TorchGeo to meet your needs, and contributing back those changes
If you have a use case that is not yet documented, please consider contributing a new Case Study tutorial!
Dependencies Datasets- Chesapeake 7/13: remove references to removed classes (#2388)
- Chesapeake CVPR: fix download link (#2445)
- EuroSAT: fix order of Sentinel-2 bands (#2480)
- EuroSAT: redistribute split files on Hugging Face (#2432)
- Forest Damage: fix _verify docstring (#2401)
- Million-AID: fix _verify docstring (#2401)
- UC Merced: redistribute split files on Hugging Face (#2433)
- Utilities: remove defaultdict from collation functions (#2398)
- Add
bandsmetadata to all pre-trained weights (#2376)
- SSL4EO: Sentinel-2 name changed on GEE (#2421)
- CI: more human-readable cache names (#2426)
- Models: test that
bandsmatch expected dimensions (#2383)
- Docs: update alternatives (#2437)
- Docs: reorganize tutorial hierarchy (#2439)
- Add Introduction to PyTorch tutorial (#2440, #2467)
- Add Introduction to Geospatial Data tutorial (#2446, #2467)
- Add Introduction to TorchGeo tutorial (#2457)
- Add TorchGeo CLI tutorial (#2479)
- Add Earth Surface Water tutorial (#960)
- Add contribution tutorial for Non-Geo Datasets (#2451, #2469)
- Add contribution tutorial for Data Modules (#2452)
- Add consistent author and copyright info to all tutorials (#2478)
- Update tutorial for transforms and pretrained weights (#2454)
- README: correct syntax highlighting for console code (#2482)
- README: root -> paths for GeoDatasets (#2438)
This release is thanks to the following contributors:
@adamjstewart
@calebrob6
@cordmaur
@giswqs
@hfangcat
@InderParmar
@lhackel-tub
@nilsleh
@yichiac -
sur GeoTools Team: GeoTools 31.5
Publié: 19 December 2024, 12:09pm CET
GeoTools 31.5 released The GeoTools team is pleased to announce the release of the latest maintenance version of GeoTools 31.5: geotools-31.5-bin.zip geotools-31.5-doc.zip geotools-31.5-userguide.zip geotools-31.5-project.zip This release is also available from the OSGeo Maven Repository and is made in conjunction with GeoServer -
sur Mappery: Nobody Is Illegal
Publié: 19 December 2024, 12:00pm CET
-
sur KAN T&IT Blog: GeoNode Cloud: Presentación oficial
Publié: 18 December 2024, 5:43pm CET
 ¡Ha llegado el momento! Presentamos GeoNode Cloud, la plataforma en la nube que transforma la gestión de datos geoespaciales.
  Sin necesidad de infraestructura interna. Escalable y confiable gracias a Kubernetes. Una solución para todos: comunidad open source, sector privado y gobierno.
 GeoNode Cloud te ayuda a lograr más con menos esfuerzo
 Empezá a explorar: GitHub – Kan-T-IT/geonode-cloud: GeoNode Cloud es una implementación avanzada de la plataforma GeoNode para la nube, integrando Geoserver Cloud para su implementación en Kubernetes.
¿Querés saber más? ¡escribinos! info@kan.com.ar o contestá este posteo#GeoNodeCloud #OpenSource #GeospatialData #CloudComputing #Nube #DatosGeoespaciales #GIS #Cloud #AWS #K8s #Kubernete #digitaltwin #smartcity
Versión en inglés: The time has come! Introducing GeoNode Cloud, the cloud platform that revolutionizes geospatial data management. No internal infrastructure needed. Scalable and reliable, powered by Kubernetes. A solution for everyone: the open-source community, private sector, and government. GeoNode Cloud helps you achieve more with less effort. Start exploring:GitHub – Kan-T-IT/geonode-cloud: GeoNode Cloud is an advanced implementation of the GeoNode platform for the cloud, integrating Geoserver Cloud for deployment on Kubernetes.Want to learn more? Write to us at info@kan.com.ar or reply to this post.
#GeoNodeCloud #OpenSource #GeospatialData #CloudComputing #Cloud #Geospatial #GIS #AWS #K8s #Kubernetes #DigitalTwin #SmartCity
-
sur Mappery: Global Fire Pit
Publié: 18 December 2024, 12:00pm CET
Pièce jointe: [télécharger]
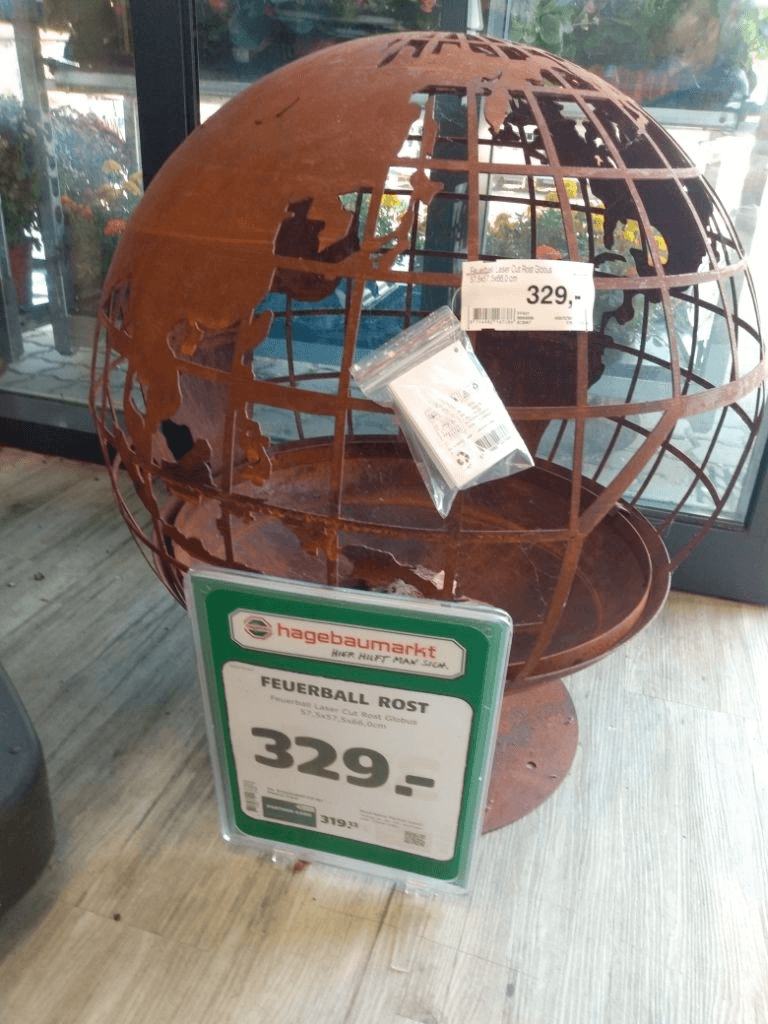
Alfons shared this, he asked “Is this meant to be macabre, cynical or educational?”
-
sur GeoServer Team: GeoServer 2.25.5 Release
Publié: 18 December 2024, 2:00am CET
GeoServer 2.25.5 release is now available with downloads (bin, war, windows), along with docs and extensions.
This is a maintenance release of GeoServer providing existing installations with minor updates and bug fixes. GeoServer 2.25.5 is made in conjunction with GeoTools 31.5, and GeoWebCache 1.25.3. The final release of the 2.25 series is planned for February 2025, please start making plans for an upgrade to 2.26.x or newer.
Thanks to Andrea Aime (GeoSolutions) for making this release.
Release notesImprovement:
- GEOS-11612 Add system property support for Proxy base URL -> use headers activation
- GEOS-11616 GSIP 229 - File system access isolation
- GEOS-11644 Introducing the rest/security/acl/catalog/reload rest endpoint
Bug:
- GEOS-11494 WFS GetFeature request with a propertyname parameter fails when layer attributes are customized (removed or reordered)
- GEOS-11606 geofence-server imports obsolete asm dep
- GEOS-11611 When Extracting the WFS Service Name from the HTTP Request A Slash Before the Question Marks Causes Issues
- GEOS-11643 WCS input read limits can be fooled by geotiff reader
Task:
- GEOS-11609 Bump XStream from 1.4.20 to 1.4.21
- GEOS-11610 Update Jetty from 9.4.55.v20240627 to 9.4.56.v20240826
- GEOS-11631 Update MySQL driver to 9.1.0
For the complete list see 2.25.5 release notes.
Community UpdatesCommunity module development:
- GEOS-11635 Add support for opaque auth tokens in OpenID connect
- GEOS-11637 DGGS min/max resolution settings stop working after restart
Community modules are shared as source code to encourage collaboration. If a topic being explored is of interest to you, please contact the module developer to offer assistance.
About GeoServer 2.25 SeriesAdditional information on GeoServer 2.25 series:
- GeoServer 2.25 User Manual
- GeoServer 2024 Roadmap Plannings
- Raster Attribute Table extension
- Individual contributor clarification
Release notes: ( 2.25.5 | 2.25.4 | 2.25.3 | 2.25.2 | 2.25.1 | 2.25.0 | 2.25-RC )
-
sur OSGeo Announcements: [OSGeo-Announce] pgRouting graduates OSGeo Incubation
Publié: 17 December 2024, 2:25pm CET
OSGeo welcomes pgRouting to its growing ecosystem of projects.
OSGeo is pleased to announce that pgRouting has graduated from incubation and is now a full-fledged OSGeo project.
pgRouting is an open-source extension in the PostGIS / PostgreSQL geospatial database, providing geospatial routing functionality.
Graduating incubation includes fulfilling requirements for open community operation, a responsible project governance model, code provenance, and general good project operation. Graduation is the OSGeo seal of approval for a project and gives potential users and the community at large an added confidence in the viability and safety of the project.
The pgRouitng Steering Committee collectively recognizes this as a big progressive step for the project.
pgRouting has been an active contributor and participant to various open source initiatives inside and outside OSGeo such as FOSS4G, OSGeo Code Sprints, OGC Code Sprints, Joint OSGeo-OGC-ASF (Apache Software Foundation) Code Sprints, and Google Summer of Code.
The pgRouitng PSC says, “We are excited about the future of the project within the OSGeo’s project ecosystem. We have been working to have a community of developers for the project sustainability. It is our honor to be an OSGeo project”.
The pgRouting PSC would like to thank our mentor, Angelos Tzotsos, and the OSGeo Incubation Committee for their assistance during this Incubator process.
Congratulations to the pgRouting community!
About pgRouting
pgRouting extends the PostGIS / PostgreSQL geospatial database to provide geospatial routing functionality. It is written in C++, C and SQL.
It is an open source PostgreSQL extension which implements several graph algorithms.
pgRouting library contains the following features:
- All Pairs Shortest Path algorithms: Floyd-Warshall and Johnson’s Algorithm
- Shortest Path and bi-directional algorithms: Dijkstra, A*
- Graph components, analysis and contraction algorithms.
- Traveling Sales Person
- Graph components, analysis and contraction algorithms.
- Shortest Path with turn restrictions
pgRouting is able to process geospatial and non geospatial graphs.
It’s processing extension execute a number of existing graph algorithms based on reliable software and libraries. It is written in such a way that gives the ability to hook a new graph algorithm in a clean way including the connection code to the database.
The pgRouting functions are standardized in terms of parameter types and names, decreasing the learning curve of a user.
pgRouting is very flexible with graph data input, in an inner SQL query and output with standardized column names, so you can process almost any kind of graph data stored in the database.
About OSGeo
The Open Source Geospatial Foundation is not-for-profit organization to “empower everyone with open source geospatial‘. The software foundation directly supports projects serving as an outreach and advocacy organization providing financial, organizational and legal support for the open source geospatial community.
OSGeo works with Re:Earth, QFieldCloud, GeoCat, T-Kartor, and other sponsors, along with our partners to foster an open approach to software, standards, data, and education.
2 posts - 2 participants
-
sur Mappery: London cap
Publié: 17 December 2024, 12:00pm CET


I found these caps in Camden, London. The coordinates point to the well-known Harrods of London.
-
sur Free and Open Source GIS Ramblings: Urban Mobility Insights with MovingPandas & CARTO in Snowflake
Publié: 17 December 2024, 11:59am CET
Today, I want to point out a blog post over at
written together with my fellow co-authors and EMERALDS project team member Argyrios Kyrgiazos.
For the technically inclined, the highlight are the presented UDFs in Snowflake to process and transform the trajectory data.

-
sur Mappery: Tattoo Shop Decor
Publié: 16 December 2024, 12:00pm CET


Erik spotted this sort of thematic map in a tattoo shop in Bratislava. I can’t work out the thematic criteria
“Nice #mapsinthewild in a tattoo shop in Bratislava. [https:]] to be exact. Walking past while on the way to the #QGISUC2024 dinner location. Map with New Zealand, but transformation might be a bit off.”
-
sur Mappery: Toronto Waterfront
Publié: 15 December 2024, 12:00pm CET
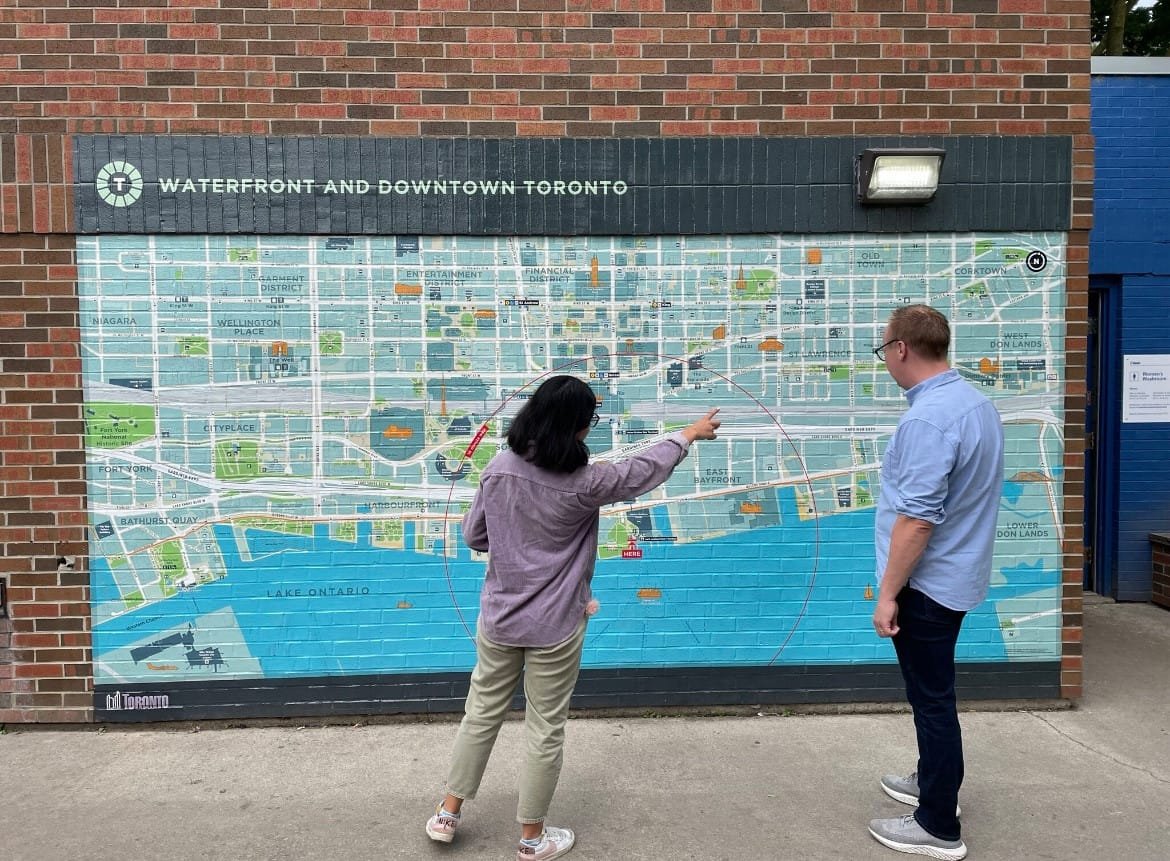

Clare shared this map of Toronto
-
sur BostonGIS: The bus factor problem
Publié: 15 December 2024, 5:11am CET
One of the biggest problems open source projects face today is the bus factor problem.
I've been thinking a lot about this lately as how it applies to my PostGIS, pgRouting, and OSGeo System Administration (SAC) teams.
Continue reading "The bus factor problem" -
sur Mappery: The New Deal
Publié: 14 December 2024, 12:00pm CET

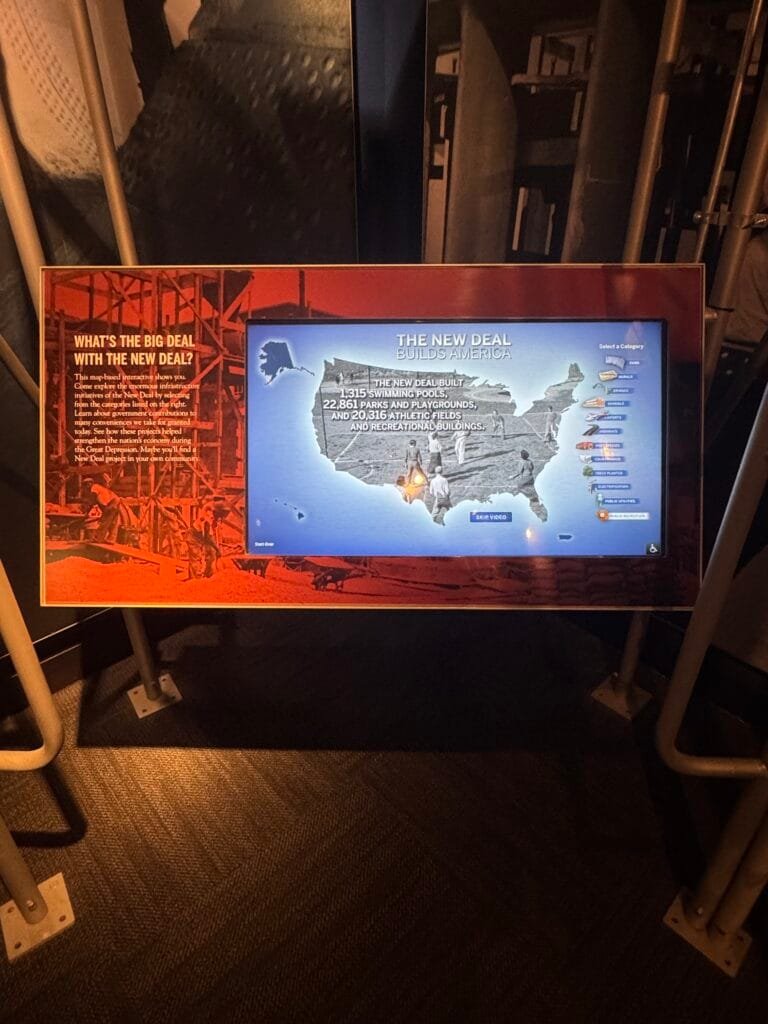
An interactive map from the FDR Museum
“Learn about government contributions to many conveniences we take for granted today. See how these projects helped strengthen the nation’s economy during the Great Depression. Maybe you’ll find a New Deal project in your own community”
-
sur QGIS Blog: Plugin Update – November, 2024
Publié: 14 December 2024, 11:24am CET
November was a really productive month, with a remarkable total of 43 new plugins published in QGIS plugin repository. In addition there are 3 more plugins from October listed here, which somehow were missed, and for that we apologize to their authors.
Here follows the quick overview in reverse chronological order. If any of the names or short descriptions catches your attention, you can find the direct link to the plugin page in the table below:
All Geocoders At Once Plugin accumulating most popular geocoders. ODK Connect Connect to ODK Central, fetch submissions, and visualize field data on QGIS maps. Supports filtering, spatial analysis, and data export. Web Service Plugin Wtyczka umo?liwia prezentacj? danych z serwisów WMS, WMTS, WFS i WCS w postaci warstw w QGIS. Wtyczka wykorzystuje dane z Ewidencji Zbiorów i Us?ug oraz strony geoportal.gov.pl Polygon grouper This plugin groups polygons together. GeoCAR Cadastro Ambiental Rural. Not-So-QT-DEM TauDEM 5.3 processing provider. GeocodeCN ????????????????
EN: A plug-in that converts addresses into latitude and longitude coordinates.Feature Navigator Este plugin permite navegar entre entidades en una capa activa de QGIS con botones de anterior y siguiente. Movement Analysis Toolbox for raster based movement analysis: least-cost path, accumulated cost surface, accessibility. Graphab3 Graphab3 for QGIS. SGTool Simple Potential Field Processing. FieldColorCoder Easily apply color codes to layers based on selected field values. NGP Connect Plugin to store files in Lantmäteriet National Geodata Platform with external storage for the attachment widget in features attribute form. Projection Factors Redux Calculates various cartographic projection properties as a raster layer. ArqueoTransectas Este complemento genera transectas arqueológicas (líneas horizontales o verticales) dentro de un área definida. Puede ser útil para estudios de campo y proyectos arqueológicos. BROnodig Plugin om BRO data te downloaden en plotten. Arches Project A plugin that links QGIS to an Arches project. Field annotations Make annotations and photos in the field. qCEPHEE Plugin QGIS for CEPHEE. Water Network Tools for Resilience (WNTR) Integration A QGIS Plugin for the WNTR piped water network modelling package. Allows the preparation of water network models and visualisation of simulation results within QGIS. FitLoader A simple plugin to import FIT files. EasyDEM Get Digital Elevation Model (DEM) datasets from multiple sources with Google Earth Engine API and load it as raster layer. Si Kataster EN: SiKataster is a tool for accessing cadastral parcel data from the Real Estate Cadastre of the Surveying and Mapping Authority of the Republic of Slovenia (GURS). The plugin is designed to record information about the source and the date of data acquisition into the metadata of the layers it creates. The data and web service are provided by GURS.
SI: SiKataster je orodje za dostop do podatkov o parcelah v Katastru nepremi?nin Geodetske uprave Republike Slovenije (GURS). Vti?nik je zasnovan na na?in, da v metapodatke slojev, ki jih ustvari, zapiše informacije o viru in datumu prevzema podatkov. Podatke in spletni servis zagotavlja GURS.Shred Layer Plugin This plugin allows users to “shred” a layer. Can be used to delete unnecessary layers or when you do not want to leave evidence. Cut layers can also be scattered on the map. otsusmethod This plugin applies Otsu’s method for automated thresholding and segmentation of raster data. Split Lines By Points Split Lines By Points. ??????? ???????????
EN: A collection of functions to implement graphics processingEasy Feature Selector The Easy Feature Selector plugin for QGIS is a practical tool designed to simplify interactions with vector data. GenSimPlot Generator of simulation plots. LockCanvasZoom The Lock and Unlock Canvas Zoom Plugin for QGIS is designed to provide users with a simple way to lock and unlock the zoom position on the map canvas. This plugin offers a toggle button that allows users to easily switch between locked and unlocked states for the map canvas zoom. GWAT – Watershed Analysis Toolbox by Geomeletitiki Semi-automated Hydrological Basin Analysis toolbox. GeoPEC GeoPEC é um software científico para avaliação da acurácia posicional de dados espaciais Esporta Tab su file CSV Esporta la tabella del layer vettoriale selezionato su un file CSV. transform_coords Transform decimal/grade-minute-second coordinates to UTM. Can also make points on the selected coordinates. Geocoder CartoCiudad CartoCiudad ofrece direcciones postales, topónimos, poblaciones y límites administrativos de España. Multi Raster Transparency Pixel Setter Set transparency pixel for multiple raster layers. InSAR Explorer InSAR Explorer is a QGIS plugin that allows for dynamic visualization and analysis of InSAR time series data. Vgrid Vgrid – Global Geocoding Systems. Profile Manager Makes handling profiles easy by giving you an UI to easily import settings from one profile to another. QGIS2Mapbender QGIS plugin to populate Mapbender with WMS services from QGIS Server. PLU Versionning Outil de suivi des versions de numérisation des documents d’urbanisme au format CNIG. Snowflake Connector for QGIS This package includes the Snowflake Connector for QGIS. Count Routes This plugin provides algorithms of network analysis. QuickRectangleCreator QuickRectangleCreator allows you to create a rectangle quickly and easily, preset sizes, snap to grid and rotate on the fly. AlgoMaps PL: Plugin Algolytics do standaryzacji danych adresowych i geokodowania.
EN: Algolytics Plugin for Address Data Standardization and Geocoding.Kue Kue is an embedded AI assistant inside QGIS.

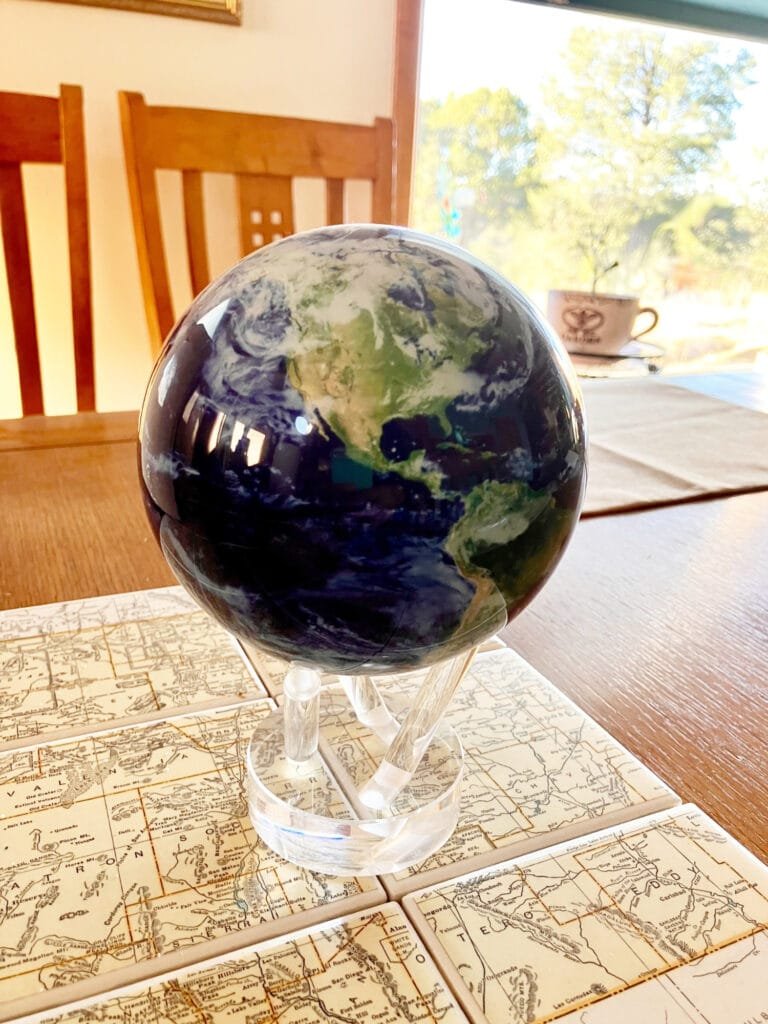


 FR
FR
